
Using the Risk Management to Generate Trading Signals
Coding the Trailing Stop Indicator
Risk management is supposed to protect your capital not generate trading signals. This being said, there are certain risk management indicators that can actually function as signal generators. This article discusses the concept of a trailing stop from a trading perspective.
I have released a new book after the success of my previous one “Trend Following Strategies in Python”. It features advanced contrarian indicators and strategies with a GitHub page dedicated to the continuously updated code. If you feel that this interests you, feel free to visit the below Amazon link (which contains a sample), or if you prefer to buy the PDF version, you could check the link at the end of the article.
Creating the Trailing Stop Indicator
The trailing stop indicator we will be creating is based on the average true range. To understand the average true range, we must first understand the concept of volatility. It is a key concept in finance, whoever masters it holds a tremendous edge in the markets.
Unfortunately, we cannot always measure and predict it with accuracy. Even though the concept is more important in options trading, we need it pretty much everywhere else. Traders cannot trade without volatility nor manage their positions and risk. Before we discuss the different types of volatility, why not look at a graph that sums up the concept? Check out the below image to get you started.
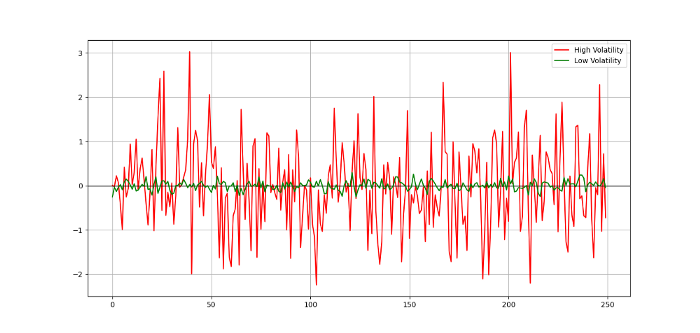
You can code the above in Python yourself using the following snippet:
# Importing the necessary libraries
import numpy as np
import matplotlib.pyplot as plt
# Creating high volatility noise
hv_noise = np.random.normal(0, 1, 250)# Creating low volatility noise
lv_noise = np.random.normal(0, 0.1, 250)# Plotting
plt.plot(hv_noise, color = 'red', linewidth = 1.5, label = 'High Volatility')plt.plot(lv_noise, color = 'green', linewidth = 1.5, label = 'Low Volatility')plt.axhline(y = 0, color = 'black', linewidth = 1)plt.grid()
plt.legend(The different types of volatility around us can be summed up in the following:
- Historical volatility: It is the realized volatility over a certain period of time. Even though it is backward looking, historical volatility is used more often than not as an expectation of future volatility. One example of a historical measure is the standard deviation, which we will see later. Another example is the Average True Range, the protagonist of this article.
- Implied volatility: In its simplest definition, implied volatility is the measure that when inputted into the Black-Scholes equation, gives out the option’s market price. It is considered as the expected future actual volatility by market participants. It has one time scale, the option’s expiration.
- Forward volatility: It is the volatility over a specific period in the future.
- Actual volatility: It is the amount of volatility at any given time. Also known as local volatility, this measure is hard to calculate and has no time scale.
Volatility is the average distance away from the mean that we expect to find when we analyze the different components of the time series.
In technical analysis, an indicator called the Average True Range -ATR- can be used as a gauge for historical volatility. Although it is considered as a lagging indicator, it gives some insights as to where volatility is now and where has it been last period (day, week, month, etc.).
But first, we should understand how the True Range is calculated (the ATR is just the average of that calculation). Consider an OHLC data composed of an timely arranged open, high, low, and close prices. For each time period (bar), the true range is simply the greatest of the three price differences:
- High — Low
- High — Previous close
- Previous close — Low
Once we have got the maximum out of the above three, we simply take a smoothed average of n periods of the true ranges to get the average true range. Generally, since in periods of panic and price depreciation we see volatility go up, the ATR will most likely trend higher during these periods, similarly in times of steady uptrends or downtrends, the ATR will tend to go lower.
One should always remember that this indicator is lagging and therefore has to be used with extreme caution.
Since it has been created by Welles Wilder Jr., also the creator of the relative strength index, it uses Wilder’s own type of moving average, the smoothed kind. To simplify things, the smoothed moving average can be found through a simple transformation of the exponential moving average.

The above formula means that a 100 smoothed moving average is the same thing as (100 x 2) -1 = 199 exponential moving average. While we are on that, we can code the exponential moving average using this function:
def add_column(data, times):

    for i in range(1, times + 1):

        new = np.zeros((len(data), 1), dtype = float)

        data = np.append(data, new, axis = 1)
return datadef delete_column(data, index, times):
for i in range(1, times + 1):
data = np.delete(data, index, axis = 1) return data
def delete_row(data, number):
data = data[number:, ]
return datadef ma(data, lookback, close, position):
data = add_column(data, 1)
for i in range(len(data)):
try:
data[i, position] = (data[i - lookback + 1:i + 1, close].mean())
except IndexError:
pass
data = delete_row(data, lookback)
return datadef smoothed_ma(data, alpha, lookback, close, position):
lookback = (2 * lookback) - 1
alpha = alpha / (lookback + 1.0)
beta = 1 - alpha
data = ma(data, lookback, close, position) data[lookback + 1, position] = (data[lookback + 1, close] * alpha) + (data[lookback, position] * beta) for i in range(lookback + 2, len(data)):
try:
data[i, position] = (data[i, close] * alpha) + (data[i - 1, position] * beta)
except IndexError:
pass
return dataAnd now, to calculate the average true range, we can define the below function:
def atr(data, lookback, high, low, close, position):

    data = add_column(data, 1)

    for i in range(len(data)):

        try:

            data[i, position] = max(data[i, high] - data[i, low], abs(data[i, high] - data[i - 1, close]), abs(data[i, low]  - data[i - 1, close]))

        except ValueError:

            pass

    data[0, position] = 0

    data = smoothed_ma(data, 2, lookback, position, position + 1)
data = delete_column(data, position, 1)
data = delete_row(data, lookback)
return data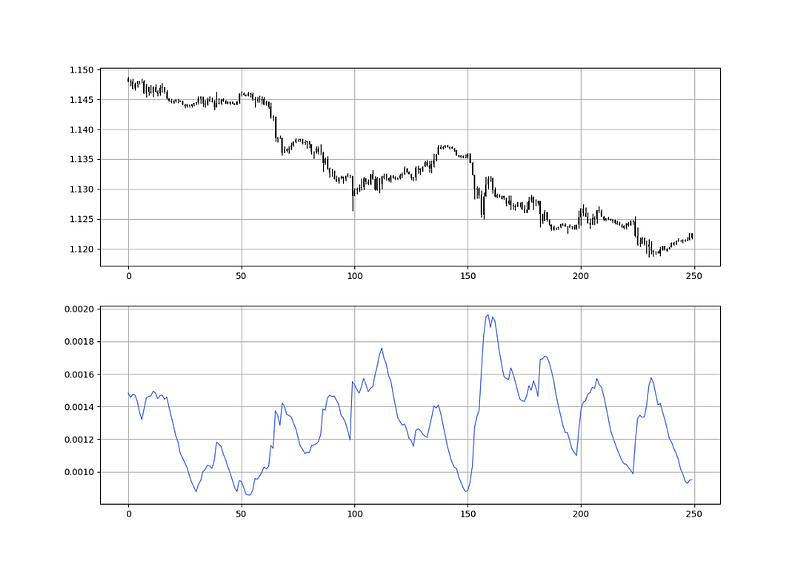
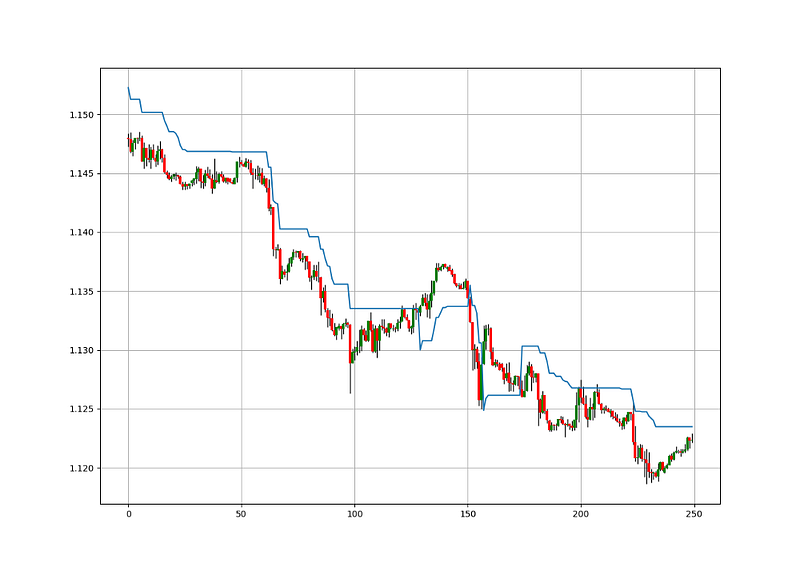
The trailing stop indicator is an overlay moving line that gives us where exactly we must move our stop when following the move. It is based on volatility, thus uses the average true range. The default version uses 13-period ATR and a multiplier of 3. The multiplier can be thought of as an ingredient in determining the position of the new stop.
def atr_trailing_stop(data, atr_column, multiplier, close, where):

    # adding columns
    data = add_column(data, 1)

    # atr trailing stop
    for i in range(len(data)):

        try:

            # stop
            stop = multiplier * data[i, atr_column]
if data[i, close] > data[i - 1, where] and data[i - 1, close] > data[i - 1, where]:
data[i, where] = max(data[i - 1, where], data[i, close] - stop)elif data[i, close] < data[i - 1, where] and data[i - 1, close] < data[i - 1, where]:
data[i, where] = min(data[i - 1, where], data[i, close] + stop)
elif data[i, close] > data[i - 1, where] and data[i - 1, close] < data[i - 1, where]:
data[i, where] = data[i, close] - stop
elif data[i, close] < data[i - 1, where] and data[i - 1, close] > data[i - 1, where]:
data[i, where] = data[i, close] + stop
except ValueError:
pass
return data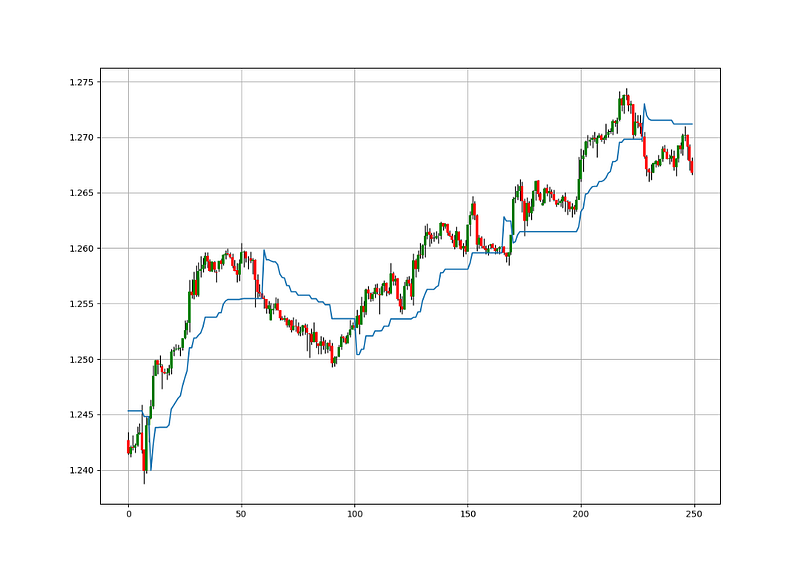
The indicator can also be used to determine changes in the market regime which is very useful for trend-following. It however needs to be optimized in every market.
Make sure to focus on the concepts and not the code. You can find the codes of most of my strategies in my books. The most important thing is to comprehend the techniques and strategies.
I have recently started following courses from Lumiwealth which offers an amazingly simple and generous knowledge in algorithmic trading, blockchain, and machine learning. I highly suggest you check them out and give them a try. Coding and finance is the future of this field.
Using the Trailing Stop Indicator
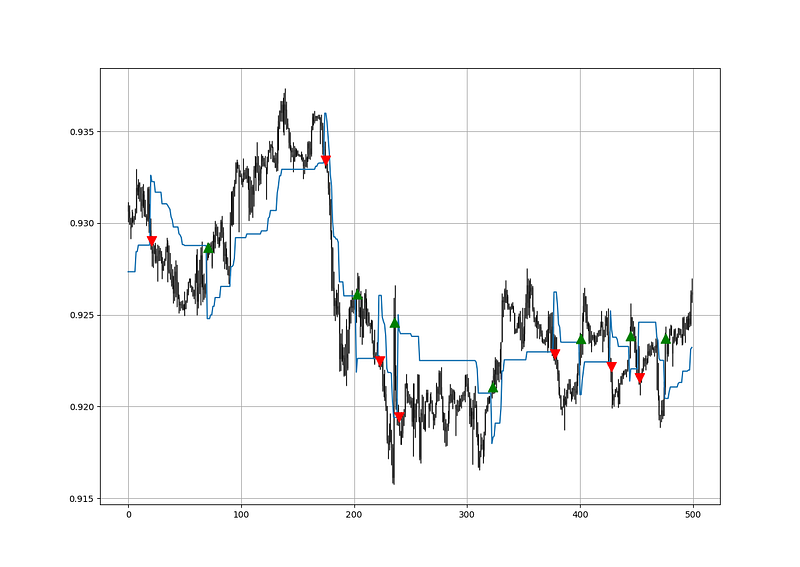
Let us use the indicator to find trading signals although this is not really its main use.
The trading conditions are as follows:
- A long (Buy) signal is generated whenever the market surpasses the trailing stop indicator.
- A short (Sell) signal is generated whenever the market surpasses the trailing stop indicator.
def signal(data, close, trailing_stop, buy_column, sell_column):

    data = add_column(data, 10)

    for i in range(len(data)):

        try:

            if data[i, trailing_stop] < data[i, close] and data[i - 1, trailing_stop] > data[i - 1, close]:

                data[i + 1, buy_column] = 1

            elif data[i, trailing_stop] > data[i, close] and data[i - 1, trailing_stop] < data[i - 1, close]:

                data[i + 1, sell_column] = -1

        except IndexError:
pass
return data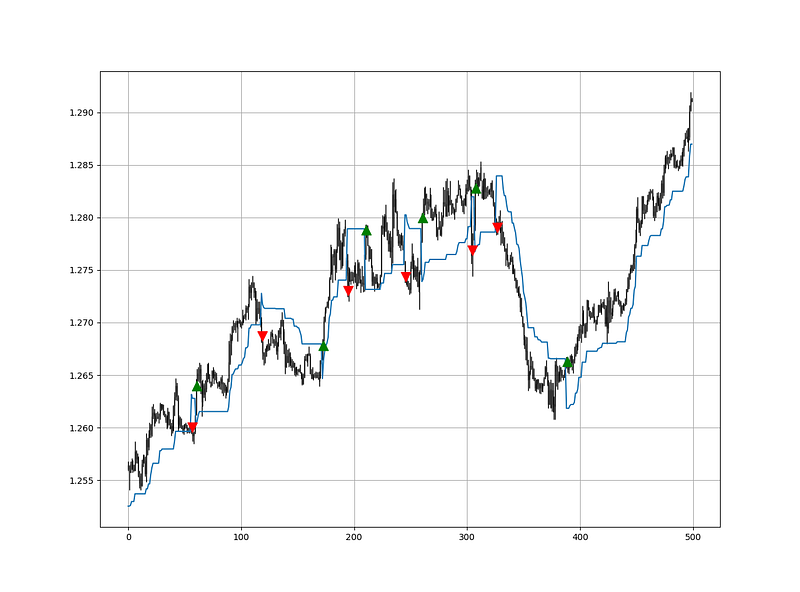
The indicator reminds us of another famous trend-following overlay called the SuperTrend where we are supposed to trade the flips between the market and the indicator.
The Right Way of Using the Trailing Stop Indicator
Now that we have stopped playing with the indicator, we have to remember that it must be used as a risk indicator in a trend-following strategy. Therefore:
- Whenever we have a buy signal generated from another technique, we can follow the stop with the trailing stop indicator.
- Whenever we have a sell signal generated from another technique, we can follow the stop with the trailing stop indicator.
The indicator as its name suggests gives us a trailing stop that helps us in out trend-following strategies. Naturally, when we initiate a trend-following position, we are hoping to squeeze out the most of the underlying move and ride it until it ends. Unfortunately, it is extremely complicated to sell exactly at the end of the move. Therefore, we can just move up our stop as the position goes in our favor. Here is a simple illustration:
- A buy position is opened on the EURUSD at 1.1000 in expectation that the bullish move will continue. We place the stop at 1.0900 and no take-profit order as we want to remain long as much as possible.
- Two days later, the EURUSD is trading at 1.1100. This is a 0.90% increase that we would like to keep at least some of it and to lock in some profits. Therefore, we move our stop to 1.1010. Now, we have a position that is up 100 pips and at worst case will be closed at a profit of 10 pips because we have moved our stop from 1.0900 to 1.1010 in order to lock it.
- Five days later the EURUSD is trading at 1.1300. We have bought initially at 1.1000. Therefore, the market is up 2.72% since opening the position. We can move our stop to 1.1200 to lock in at least a 1.81% profit.
- Finally, a day after reaching 1.1300, the EURUSD corrects to 1.1800. Our stop is triggered at 1.1200 with a profit of 2.72%.
Summary
To summarize up, what I am trying to do is to simply contribute to the world of objective technical analysis which is promoting more transparent techniques and strategies that need to be back-tested before being implemented. This way, technical analysis will get rid of the bad reputation of being a subjective and scientifically unfounded.
Medium is a hub to many interesting reads. I read a lot of articles before I decided to start writing. Consider joining Medium using my referral link (at no additional cost to you).
I recommend you always follow the the below steps whenever you come across a trading technique or strategy:
- Have a critical mindset and get rid of any emotions.
- Back-test it using real life simulation and conditions.
- If you find potential, try optimizing it and running a forward test.
- Always include transaction costs and any slippage simulation in your tests.
- Always include risk management and position sizing in your tests.
Finally, even after making sure of the above, stay careful and monitor the strategy because market dynamics may shift and make the strategy unprofitable.
For the PDF alternative, the price of the book is 9.99 EUR. Please include your email in the note before paying so that you receive it on the right address. Also, once you receive it, make sure to download it through google drive.