
Using The CNN Fear & Greed Index In Stock Trading Strategies

The CNN Fear and Greed Index is a critical tool for traders, encapsulating market emotions that drive stock prices. This Index, ranging from 0 (maximum fear) to 100 (maximum greed), is calculated using seven key components:
- Market Momentum
- Stock price strength
- Stock price breadth
- Put and call options
- Market volatility
- Safe haven demand
- Junk bond demand
Each factor contributes equally to the final score, providing a holistic view of the market's emotional state.
For traders, this publicly available Index is invaluable. It offers insights as an alternative data source beyond traditional financial metrics, highlighting whether rational strategies or emotional reactions drive current market trends.
Extreme readings on the Index often signal potential market turning points: a high score might indicate an overvalued market poised for a correction. In contrast, a low score could suggest undervalued stocks and buying opportunities.
This article will compare the relationship between this Index and some popularly traded stocks. We will also fit a simple trading strategy to see how it performs over the traditional SPY buy-and-hold strategy.
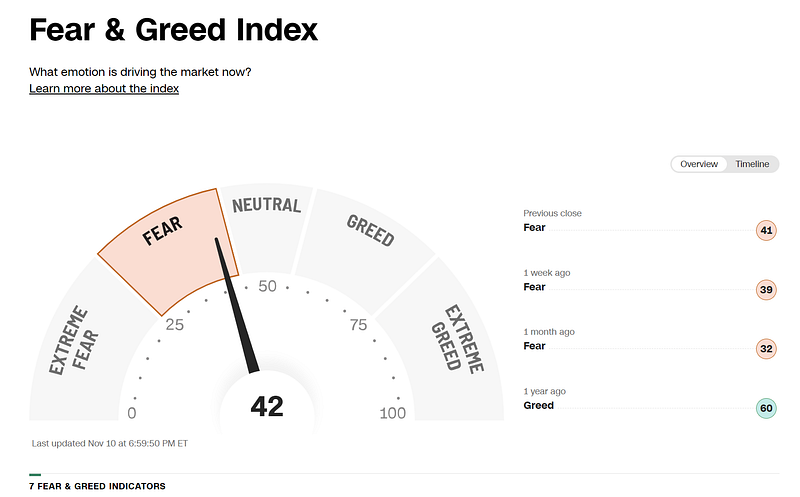
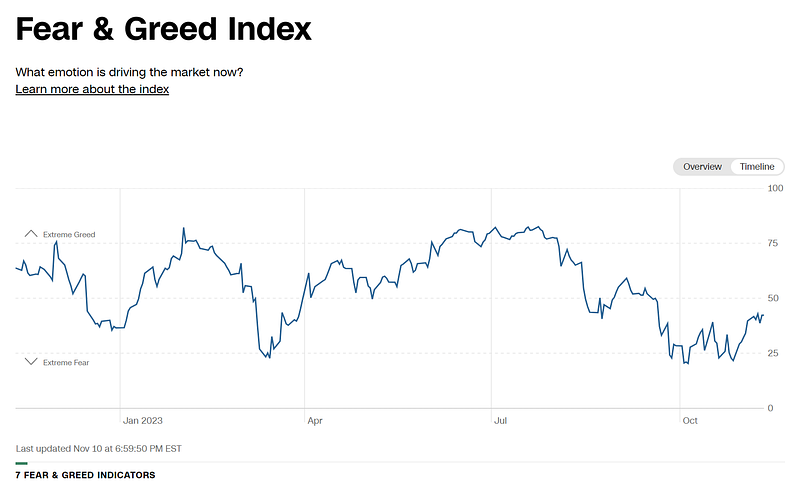
As seen in the image above, the snapshot provides just a single day of data, but if we select the timeline, we can obtain historical data to uncover trends, etc. The Index currently populates the last year or 365 data points.
The first step would be obtaining this data. We will use a Python script to automate this data collection process.
Take Your Trading to the Next Level — Get the Barebone Jupyter Notebook Script Now!
Interested in exploring how the Fear and Greed Index can enhance your trading system? We’ve got just the thing for you.
Our Python script, designed for this specific strategy, is available for purchase. It’s a barebones framework perfect for testing, building upon, or integrating into your trading strategies.
Grab this script and start harnessing the power of market sentiment in your trades today!
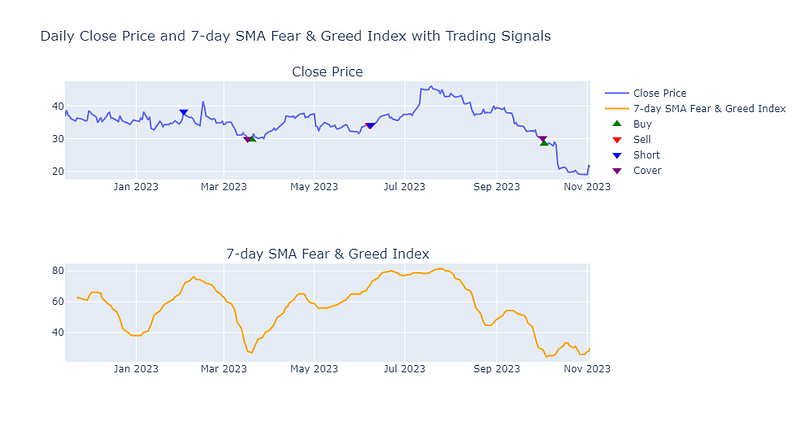
Extracting the value from the Index, we also fit a simple moving average of 7 days to smooth the trends.
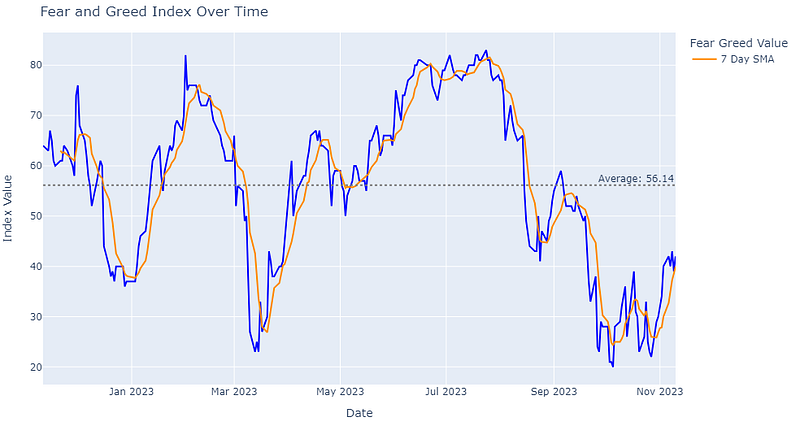
We can also see that the Index is trending way below the yearly average. However, the Index has been increasing over the past couple of weeks.
Now, let's check the correlation between the fear and greed Index and a couple of stocks to visualise the relationship, if any.
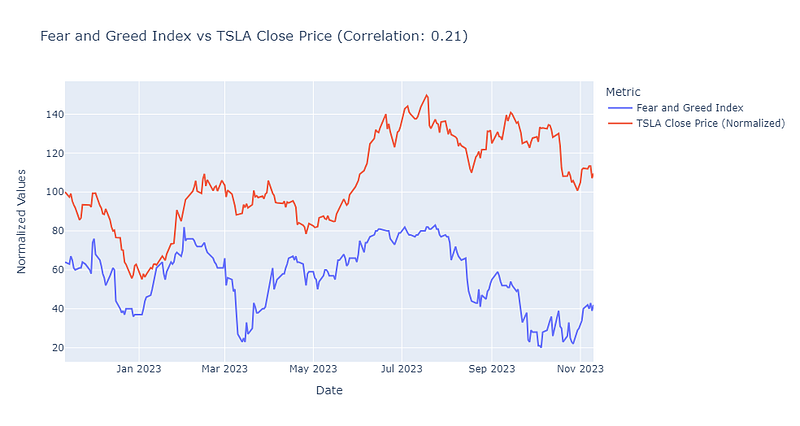
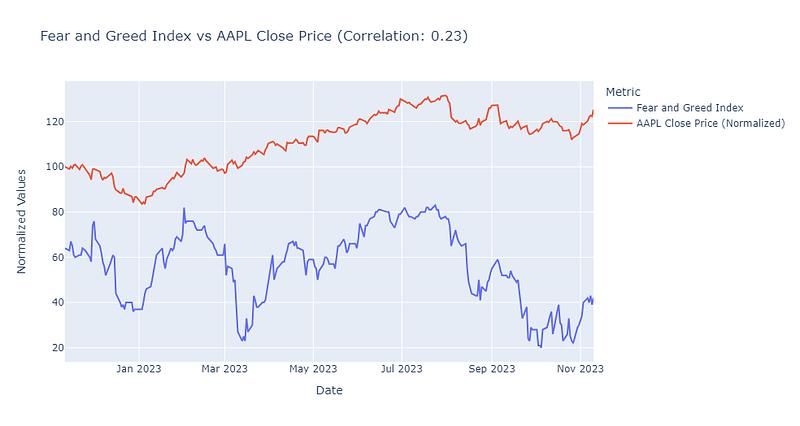
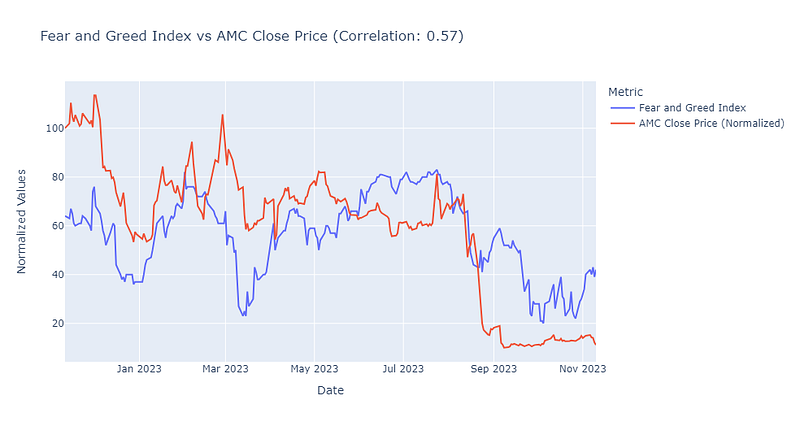
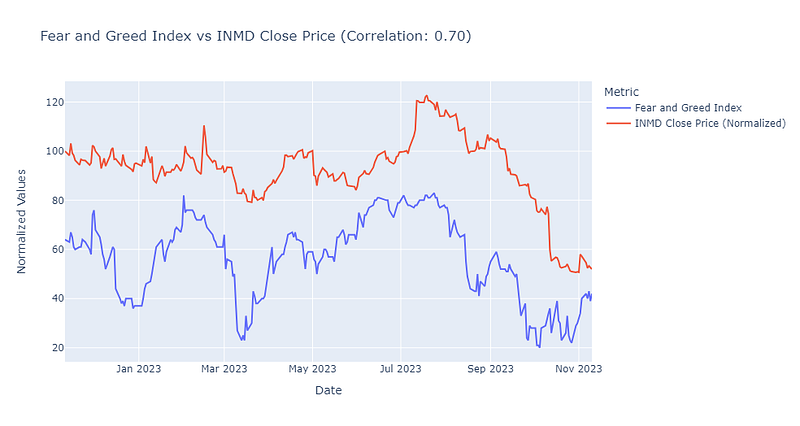
Since we obtained the highest correlation from the stock INMD, let us use this as our example.
With that in mind, let us modify it a little and build a simple trading strategy that calculates the seven days moving average of the Fear & Greed index score, and based on that value, we generate the following signals and criteria:
- Long / Buy when the 7-day moving average of the Fear & Greed index score is below 30 and sell when the score is above 70.
- Then we reverse and Short / Sell when the score is above 70 and cover when the score reaches below 30.
- We also assume a starting capital of $10,000.
- Transaction costs of $2.
- No interest on borrowed shares for shorting, etc.
- Based on the signals, the algorithm would always deploy 50% of the capital to purchase shares.
With these, we managed to obtain the following results:
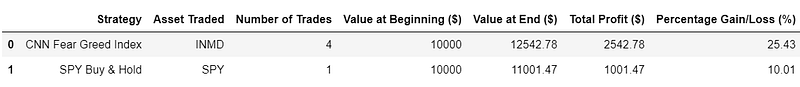
We can conclude that incorporating alternative data signals, such as the CNN Fear and Greed Index, could offer a unique blend of market sentiment and hard data.
But why stop here? There are many ways to incorporate such data and strategies into your existing systems. If you are interested, feel free to check out similar articles such as:
Happy trading!
P.S. Are you looking to organise all your trading charts, strategies and markets in one place?


