
Using TensorTrade for Making a Simple Trading Algorithm
In this tutorial, I’m going to show how to use Ray with TensorTrade (TT) in order to create a profitable algorithm on a predictable sine curve. You may be asking yourself, why use something so simple when the real world is much more difficult to predict? This is a very good question, and there is a simple answer.
“The man who moves a mountain begins by carrying away small stones.” - Confucius
Before trying to jump into the world of complex trading environments, a simple sine curve can be used to perform a sanity check on your trading algorithm. The reward and action scheme used should be able to make money on a predictable pattern. If it doesn’t, then there is no possibility success will be found on a more complex environment.
There are some questions to ask before wasting time and resources in developing an algorithm. Primarily, does the reward function correctly specify the goal? In this tutorial, I’ll show a reward and action scheme that can be used to train an agent to make profitable decisions on a sine curve.
Architecture
First, we need to install some libraries.
$ pip install tensortrade==1.0.1b0 ray[tune,rllib] symfitNow let’s import everything we need to run our code.
Let’s define two instruments we want to have in our portfolio. We’ll use the U.S. dollar and a fake coin called TensorTrade Coin.
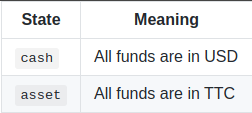
Ideally, we expect our agent to sell at the peaks and buy at the troughs. I’ll define actions that will allow us to perform this behavior. The ActionScheme I’ve built is extremely simple, relying on only two internal states: cash and asset.
The following is a transition diagram showing the states along with the actions that can be made: stay and move.
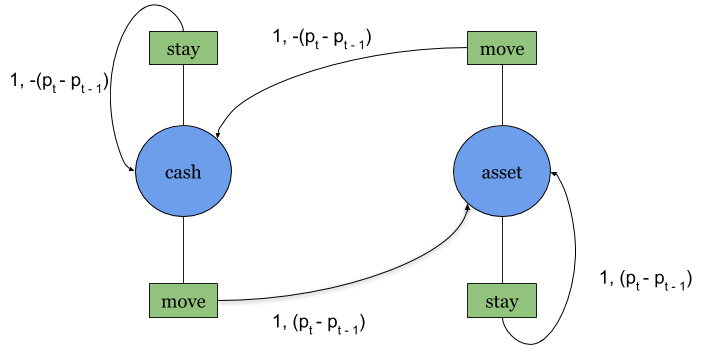
For example, if I start in cash and choose move, then I’ll transition to asset and receive P(t)-P(t-1) as a reward, where P(t) is the price of the asset at time step t. The rewards ascribed to these arrows will be described in further detail below.
Next, I’ll create a reward scheme to reflect how well we are positioned in the environment. Essentially, we want a mapping that reflects the correct reward for each state we are in.
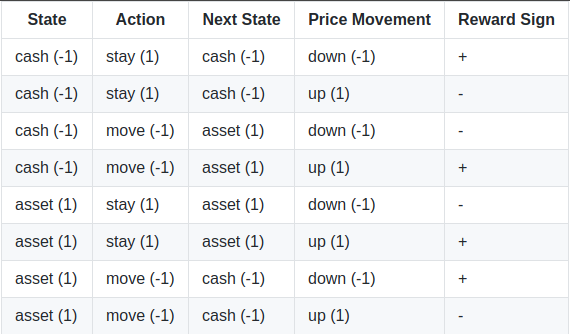
The table shows what signs the reward should have in different scenarios. In the first row, for example, given the agent is in the cash state and chooses to stay while the price moves down, then there will be a positive reward. The other rows can be read in the same manner. To capture this reward function, I’ll create a position-based reward (PBR) scheme. Let s(t), a(t), and p(t) be the state, action and price at time step t, respectively. Then we can define the reward, r(t), as:

Earlier, I mentioned an example where we start in cash and chose move. Following the equation above, this translates to:

The rewards generated by this function are shown on the arrows of the transition diagram, as previously defined above.
Finally, we would like to make sure we can see if the agent is selling at the peaks and buying at the troughs. Here is a Renderer that can display this information using Matplotlib.
Train
In order to use our custom environment in ray, we must first write a function that creates an instance of the TradingEnv from a configuration dictionary.
Since the environment is registered, we can use the Proximal Policy Optimization (PPO) algorithm from rllib to train our agent.
To check if everything works, set a low episode_reward_mean so a fast check can be done (set at 10). Once everything is working, set it to 500 and run the training. Once the training is complete, we can get access to the agent’s policy by restoring from the last checkpoint.
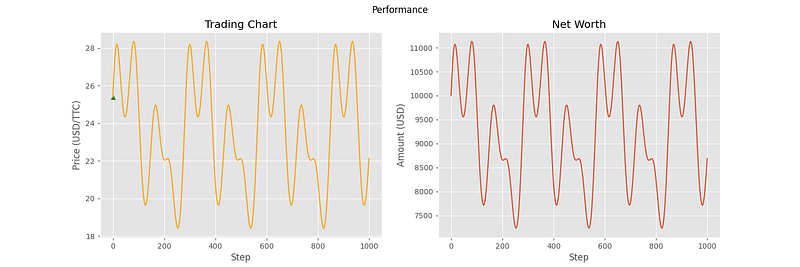
Now let’s get a visualization of the agent’s decision making on the sine curve by rendering the environment.
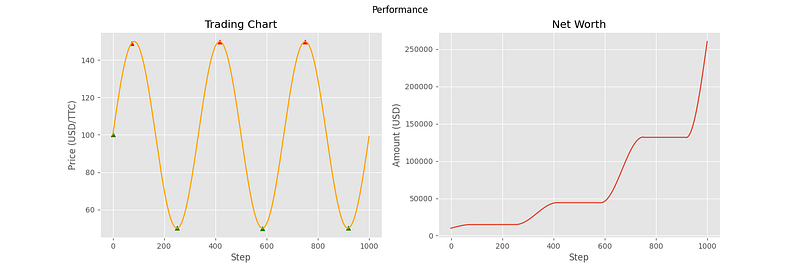
From the chart, we can see that the agent is making near optimal decisions on the environment. This aligns with our expectations, and confirms that the reward function is working properly. Now let’s put the agent in an environment it is not used to and see what kinds of decisions it makes.
Evaluate
To make the price curve more challenging, I’ve used the symfit library to fit an order 5 Fourier series to a randomly generated Geometric Brownian Motion (GBM).
Now I can make the evaluation environment and see how the agent performs. Although this is not a proper evaluation, it still provides a good visual heuristic for gauging how the agent would react in different situations.
The following charts are from 6 different samples using this evaluation environment.
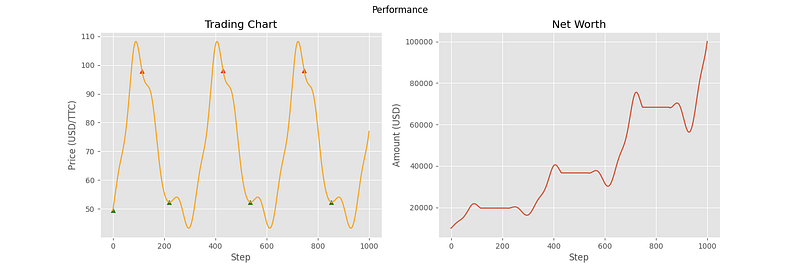
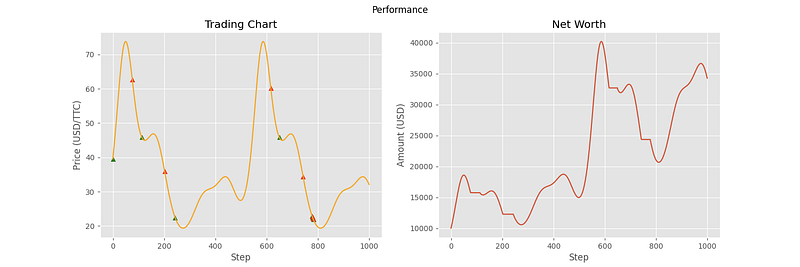
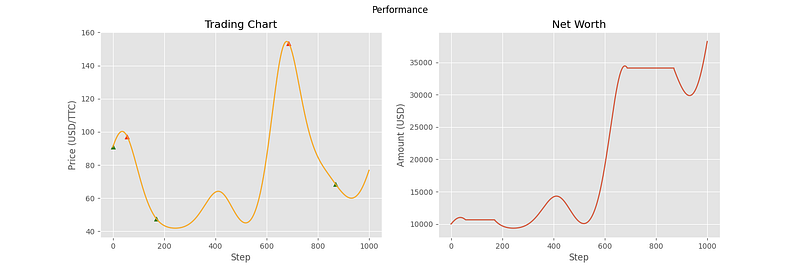
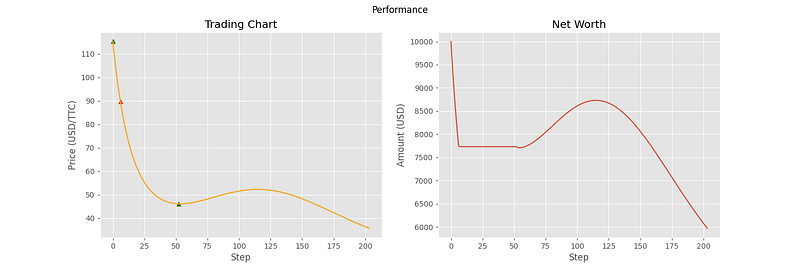
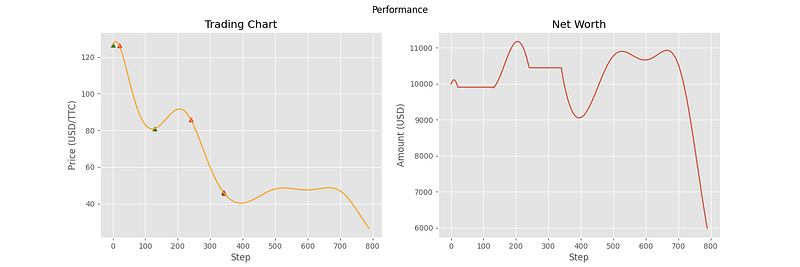
As you can see, the agent has been able to make correct decisions on some of the price curves, but not all of them. In particular, the last three curves showcase some of the shortcomings of the agent. In samples 4 and 5, it doesn’t seem to understand that the general trend is downward, and that it should transfer all of its assets into cash. For sample 6, the agent seemed to stop making decisions altogether. This can most likely be attributed to the high volatility of the price curve, containing many local minima and maxima relative to the first three curves. With the price changing so fast, the agent decides that the best option is to hold the entire time.
Conclusion
Our main goal was to test that our reward and action scheme could be used to train an agent to make profitable decisions on a simple sine curve. Despite the suboptimal performance on some of the latter samples, the objective here was to get insight into agent decisions and inform how we engineer future reward schemes. From these basic concepts, you can work up to building more complex action and reward schemes, from which successful algorithms can be made. There is no limit to the kinds of trading environments that can be created with TensorTrade, and I encourage everybody to experiment with the different possibilities. So that about wraps up this tutorial! You can checkout the TensorTrade library to learn more on how to use it to make your own trading environments.
What have we learned?
- Make an environment in TensorTrade.
- Create a custom
ActionScheme,RewardScheme, andRenderercomponents. - Using a simple price curve to understand more about actions and rewards in our use case.
- Using
rayto train and restore an agent. - Making evaluation environments for providing insight into the decisions of an agent.
Code
See you in the next tutorial!


