
Fourier Transform Can Predict Stock Prices : An Introduction to Time Series Analysis
The stock market is constantly fluctuating, making it difficult to predict future trends. Investors and traders often rely on various tools and techniques to forecast price movements, but traditional methods can be complex and time-consuming. Fortunately, Fourier transform, a powerful mathematical tool, can be used to analyze stock price data and make predictions. In this article, we will explore the basics of Fourier transform and show how it can be used to predict stock movements with Python.
What is Fourier Transform?
Fourier transform is a mathematical technique that decomposes a complex signal into its constituent frequencies. It is commonly used in signal processing, image analysis, and other fields where data analysis is required. In the context of stock price data, Fourier transform can be used to analyze the periodicity of price movements and identify underlying trends.
The basic equation for Fourier transform is:

where F(ω) is the Fourier transform of the signal f(t), ω is the frequency, and i is the imaginary unit. In essence, this equation tells us how much of each frequency component is present in the original signal.
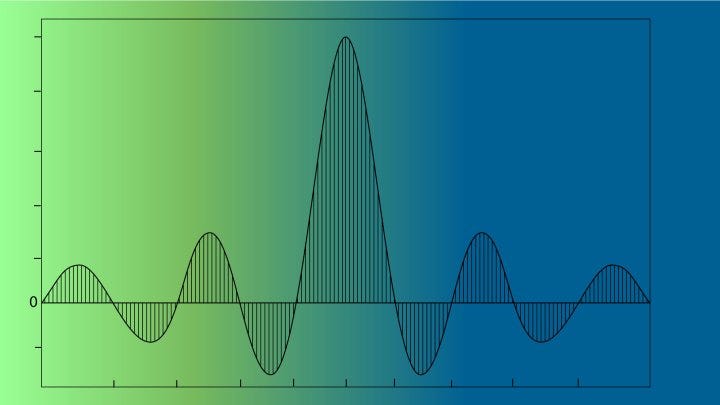
To understand how Fourier transform works, let’s consider an example. Imagine you are playing a musical instrument like a guitar. When you pluck a string, the string vibrates and produces a sound wave with a particular shape, known as the waveform. The waveform can be represented as a time-domain signal, which shows how the amplitude (or loudness) of the sound varies over time.
Now, suppose you want to analyze the sound produced by the guitar and identify the individual frequencies that make up the sound. This is where Fourier transform comes in. Fourier transform takes the time-domain signal and converts it into a frequency-domain signal, which shows how much of each frequency component is present in the original signal.
In the context of stock price analysis, Fourier transform can be used to identify the dominant frequency components of historical price data. For example, suppose you are analyzing the stock prices of a company over a period of time. By performing Fourier transform on the price data, you can identify the frequency components that are most dominant in the data. This can help you identify patterns or trends in the data that might not be visible in the raw price data.
Using Fourier Transform to Predict Stock Movements:
To use Fourier transform to predict stock movements, we first need to collect historical price data. This data can be obtained from various financial websites or APIs. Once we have the data, we can use Python libraries such as NumPy and SciPy to perform Fourier transform and analyze the frequency spectrum.
Here’s an example code snippet in Python:
import numpy as np
import scipy.fftpack

# Load historical price data
prices = np.loadtxt('prices.csv')

# Perform Fourier transform
frequencies = scipy.fftpack.fftfreq(len(prices))
spectrum = np.abs(scipy.fftpack.fft(prices))

# Find dominant frequency
dominant_frequency = frequencies[np.argmax(spectrum)]

# Predict future trend
if dominant_frequency > 0:
    print("The stock is likely to increase in price.")
else:
    print("The stock is likely to decrease in price.")
In this example, we load historical price data from a CSV file and perform Fourier transform using SciPy’s fftpack module. We then find the dominant frequency in the frequency spectrum and use it to predict the future trend of the stock. If the dominant frequency is positive, we predict an increase in price, and if it is negative, we predict a decrease in price.
You can automate your option trade using this prediction strategy combined with others . I have defined some options strategy automation in below mentioned blog.
Automate Your Options Trading Strategy Using Python: A Beginner’s Guide
Fourier transform is a powerful tool that can be used to predict stock movements with relatively simple calculations. By analyzing the frequency spectrum of historical price data, we can identify underlying trends and make predictions about future price movements. While no method is foolproof, Fourier transform offers a new perspective on stock price analysis and can be a valuable addition to any trader or investor’s toolbox.
If you liked my content , buy me a coffee.

Note:This article is curated using AI-assisted tools.
New to trading? Try crypto trading bots or copy trading on best crypto exchanges
Join Coinmonks Telegram Channel and Youtube Channel get daily Crypto News


