Using Machine Learning to Create Custom Color Palettes
Behind the scenes look at Streamlit’s app of the month
Intro
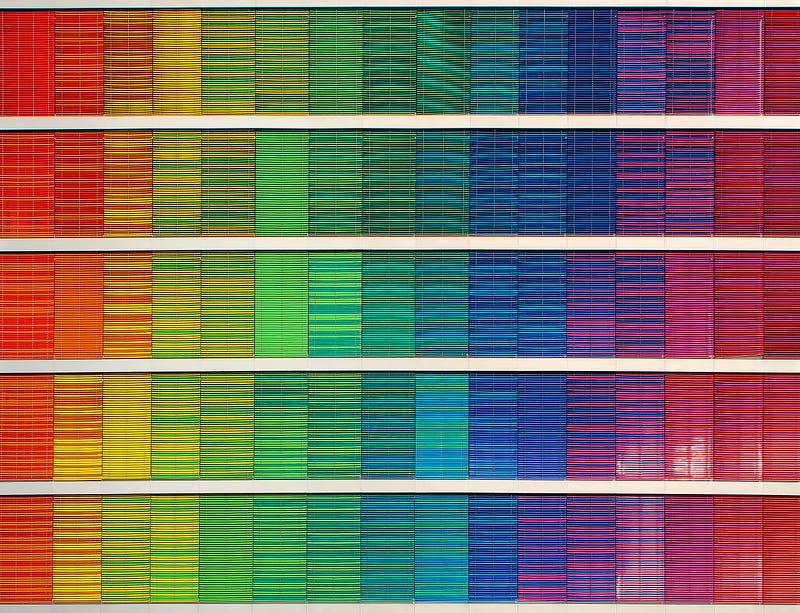
We all love getting our hands on a new dataset, exploring it, and learning from it. But raw numbers by themselves are not great storytellers. Our primal brains are wired for lines, shapes, and colors. That’s why numbers need to be visualized to tell a good story.
The color palette of your data visualization can make or break your data story though. While coming up with the perfect set of colors for your data visualization can be an exacting and time-consuming task, you don’t have to do it all on your own. Instead of starting from scratch, you can get inspiration from the greatest painters and artists in history.
Creating a color palette from scratch typically falls within the domain of expertise of visualization engineers and designers who use color theory to put together harmonious palettes suitable for various visualization purposes (e.g. monochromatic palettes for sequential or gradient plots, or complimentary palettes for categorical charts). Visualization packages like matplotlib or plotly already come with an amazing collection of such color palettes.
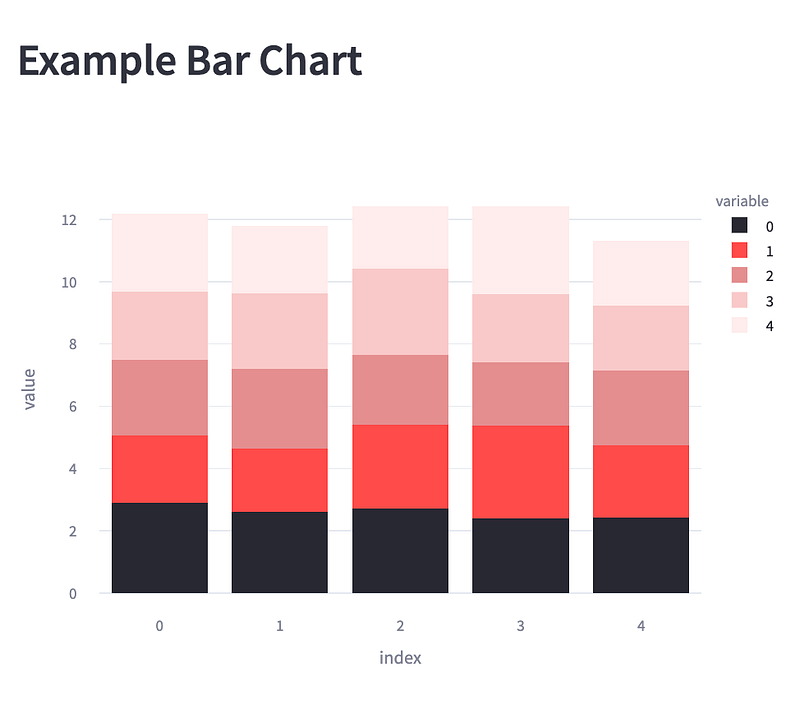
While data analysts and data scientists can get by using pre-made color palettes, there are situations where we may want to put together our own custom palette. An example scenario is when you want to make a visualization that is aligned with your company’s color theme. For example, you may want to create a bar chart that has a theme matching your favorite company’s logo. It would be really nice to have an app that does this for you automatically, right?
I spend way too much time trying to come up with the perfect set of colors for my visualizations, so I decided to make the process a bit easier for myself.
I built a web app using Streamlit 🎈 that can infer color palettes from any input image: paintings, movie posters, rock album covers, Christmas family photos, you name it! While the app may not give you the perfect color palette right out of the box, it will at least give you a great starting point.
So let’s see how I built this app.
Building a Color Palette Inference App
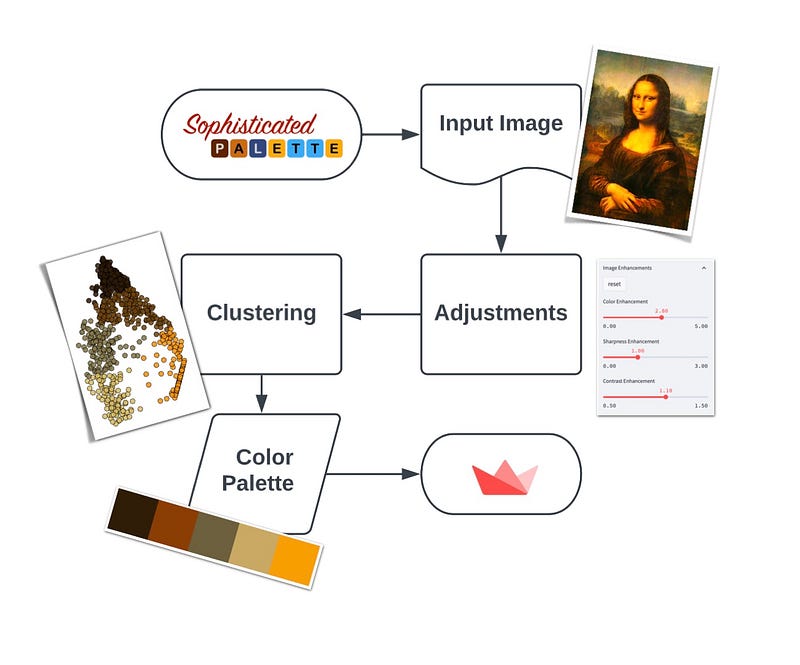
In order to create a color palette inference tool we need a few components.
In this post, I’ll teach you:
- How to construct an image-loading component
- How to build an image enhancement component with sliders
- How to cluster pixels and use group averages to make a palette
- How to use the color picker widget to display and modify the palette
Want to try the app firsthand? You can check it out here and see the source code here.
1. How to construct an image-loading component
The first element we need for our app is a way to input the image we want to convert to a color palette. There are three ways we can do this:
- Load from the pre-existing gallery of images or artworks.
- Upload a new image file into the app using
st.file_uploader(). - Download a new image into the app from a URL.
We can construct three different tabs usingst.tabs() that allow us to switch between these three input modes seamlessly.
st.tabs().Because of the way Streamlit runs the app (top-to-bottom), the input modes that come later will get higher priority and will overwrite the output of the previous loader. For example, since you ordered the input modes as Gallery → File Uploader → Image URL, if you save the image into a variable img, anything loaded by the gallery will be overwritten by the file uploader and URL downloader outputs.
You can add pop-up warnings for the user when they load an image with a loader lower in the hierarchy and an image is already loaded with a loader higher in the hierarchy.
This is what the code will look like:
# define three tabs for the three loading methods
gallery_tab, upload_tab, url_tab = st.tabs(["Gallery", "Upload", "Image URL"])
with gallery_tab:
...
# raise a warning if file uploader or URL downloader have already loaded an image
if st.session_state.get("file_uploader") is not None:
st.warning("To use the Gallery, remove the uploaded image first.")
if st.session_state.get("image_url") not in ["", None]:
st.warning("To use the Gallery, remove the image URL first.")
img = ...
with upload_tab:
img = ...
# raise a warning if the URL downloader has already loaded an image
if st.session_state.get("image_url") not in ["", None]:
st.warning("To use the file uploader, remove the image URL first.")
with url_tab:
img = ...So if you’re trying to load a pre-existing image from the gallery, but there is an existing link in the URL downloader, you’re going to have to remove that first. It may not be the most elegant solution, but it works!
Now, on to the implementation of each piece of the loading methods.
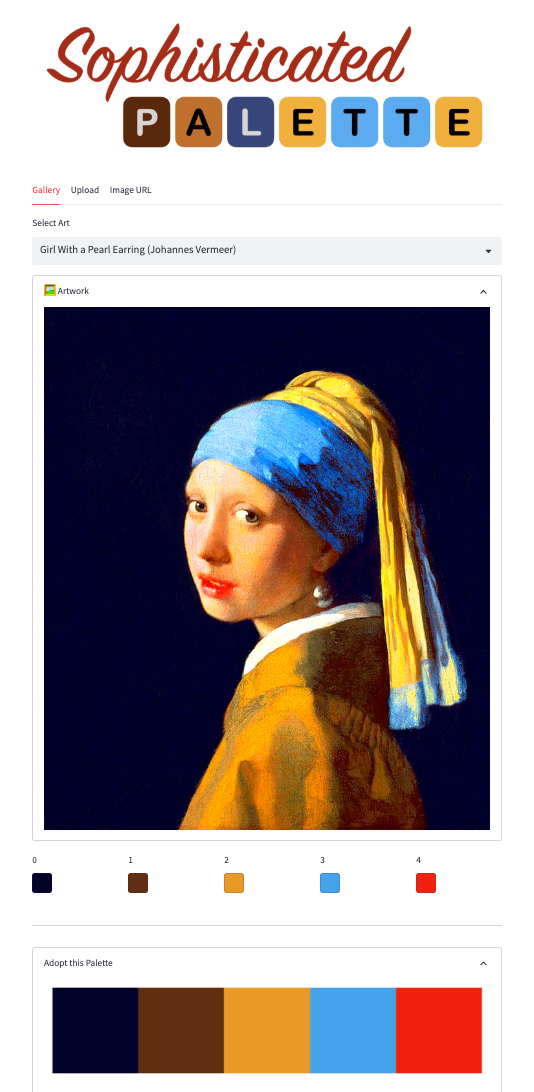
Gallery View
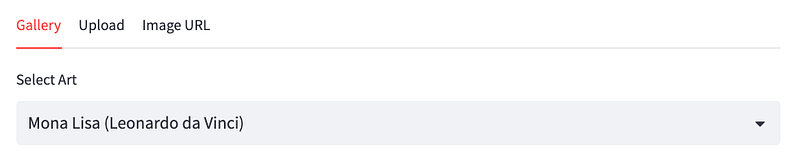
For the gallery view, we can simply save some images in a public repository and load those directly in the app (I’m using GitHub here, but you can also use AWS S3 or Google Cloud Storage). The st.selectbox contains the names of the artworks I have saved, so the user can load them simply by selecting them from the dropdown menu. Here is what the implementation looks like.
import streamlit as st
from PIL import Image

with gallery_tab:
    options = list(gallery_dict.keys())
    file_name = st.selectbox("Select Art",
                             options=options,
                             index=options.index("Mona Lisa (Leonardo da Vinci)")
                             )
    img_file = gallery_dict[file_name]

    if st.session_state.get("file_uploader") is not None:
        st.warning("To use the Gallery, remove the uploaded image first.")
    if st.session_state.get("image_url") not in ["", None]:
        st.warning("To use the Gallery, remove the image URL first.")

    img = Image.open(img_file)
gallery_dict is a dictionary that has a file name and image file path as key-value pairs, and PIL.Image.open() is used to load those files. The results are saved in a variable named img.
File Uploader
Implementing the file uploader is very easy because there is already a Streamlit widget for it. It’s called (can you guess?) st.file_uploader()!
Here is what the implementation looks like:
with upload_tab:
    img_file = st.file_uploader("Upload Art", key="file_uploader")
    if file is not None:
        try:
            img = Image.open(img_file)
        except:
            st.error("The file you uploaded does not seem to be a valid image. Try uploading a png or jpg file.")

    if st.session_state.get("image_url") not in ["", None]:
        st.warning("To use the file uploader, remove the image URL first.")
This widget allows you to upload a file that you can consequently pass to PIL.Image.open() to load. This step may break if the file is not actually an image file, or has a format inconsistent with what PIL.Image expects. To prevent this from becoming an issue we can put the loading part into a try/except block.
⚠️ Here I’m using this block as a catch-all to avoid all sorts of unexpected errors when loading a file. However, it is normally not recommended to use except without actually specifying the Exception type you are trying to bypass, especially because deadly errors you are not aware of will pass through the block silently, making it difficult for you to debug your code.
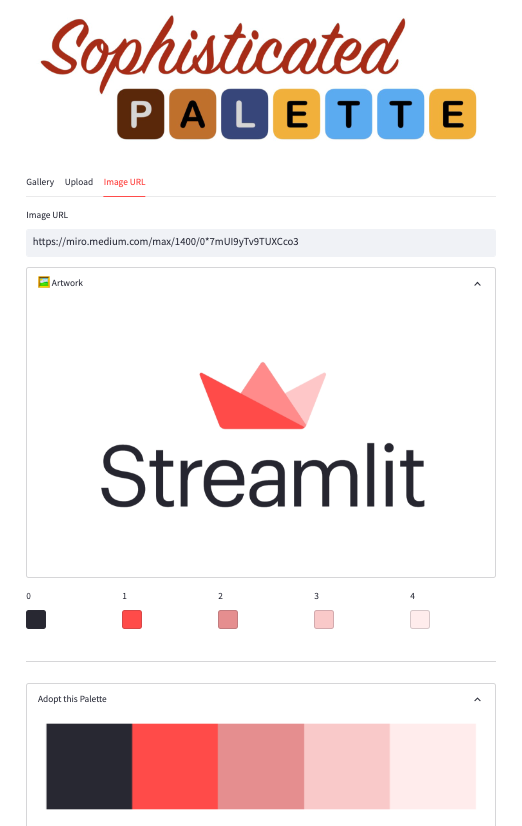
URL Downloader
Let’s face it! While uploading files is a great way for users to load their custom images they want to infer the color palettes from, it’s not the easiest way. The user will have to find the image (if they don’t have it already), download it locally, then upload it to the app. Sounds easy, but annoying in practice.
In order to remove this barrier, we can add a URL downloader to the app so the user can simply copy the image link (e.g. from google search results) and simply paste it into the app. In order to accomplish this, we need the requests module, which gets us the contents of the URL, and the io.BytesIO function which makes the contents comprehendible by PIL.Image.open(). The implementation is simple and quite similar to what we did for the file uploader.
import requests
from io import BytesIO

with url_tab:
    url_text = st.empty()

    url = url_text.text_input("Image URL", key="image_url")

    if url != "":
        try:
            response = requests.get(url)
            img = Image.open(BytesIO(response.content))
        except:
            st.error("The URL does not seem to be valid.")
2. How to build an image enhancement component with sliders
Now that we have the image uploaded, we are ready to infer the color palette, right? Not exactly.
The original image you load into the app may not be optimized for color inference. The colors may be too dull, and you may not have enough brightness or contrast across the canvas. That’s why you need to do some image adjustments first.
In order to apply enhancements to the image, we can use PIL.ImageEnhance . The API is very simple. For example, if you want to enhance the color of the image (loaded into img ) by a factor of 2.5, you can run:
img = ImageEnhance.Color(img)
img = img.enhance(2.5)
Simply replacing Color with Shapness, Contrast, or Brightness will adjust these image attributes respectively. We could create four different sliders that assign values to each of these attributes, and then write separate blocks of code and apply the enhancements to the image in turn. But we are good programmers, and we try to keep our codes beautiful and DRY (Don’t Repeat Yourself) as much as possible. So let’s approach this a bit more pragmatically.
We can define a dictionary that contains all the enhancements we want to apply as keys, with values indicating the ranges and step sizes of the sliders we want to assign to them in the app.
enhancement_range = {
  # "enhancement_type": [min, max, step_size]
    "Color": [0., 5., 0.2],
    "Sharpness": [0., 3., 0.2],
    "Contrast": [0.5, 1.5, 0.1],
    "Brightness": [0.5, 1.5, 0.1]
}
enhancement_categories = enhancement_range.keys()
# put adjustment sliders inside an expander
enh_expander = st.sidebar.expander("Image Enhancements", expanded=False)
# create a reset button that resets all enhancements to default value (1.0)
with enh_expander:
    if st.button("reset"):
        for cat in enhancement_categories:
            if f"{cat}_enhancement" in st.session_state:
                st.session_state[f"{cat}_enhancement"] = 1.0
# create sliders for each enhancement category using the dictionary values (min, max, step_size)
enhancement_factor_dict = {
    cat: enh_expander.slider(f"{cat} Enhancement",
                            value=1.,
                            min_value=enhancement_range[cat][0],
                            max_value=enhancement_range[cat][1],
                            step=enhancement_range[cat][2],
                            key=f"{cat}_enhancement")
    for cat in enhancement_categories
}
Using this approach, if we want to change the enhancement type or the range of values, we only need to change the original dictionary.
Now that we have the sliders on the sidebar, the only thing left is to apply the values to the image using ImageEnhance.
from PIL import ImageEnhance
for cat in enhancement_categories:
  # apply the enhancement class to the image
  # e.g. for cat='Color' this would be the same as
    # img = ImageEnhance.Color(img)
    img = getattr(ImageEnhance, cat)(img)

  # apply the enhencement value from the corresponding st.slider
    img = img.enhance(enhancement_factor_dict[cat])
Show the Image
Now that we have the image loaded, the only thing left is to show it on the app using st.image():
with st.expander("🖼  Artwork", expanded=True):
    st.image(img, use_column_width=True)
and Voilà!
3. How to cluster pixels and use group averages to make a palette
Finally, onto the fun stuff! Using machine learning to infer the color palette.
The idea here is very simple. An image is a collection of pixels that each have three values assigned to them: R, G, B. These values basically tell you how much red, green, and blue each pixel contains. To infer the color palette, the actual location of the pixel on the canvas is virtually irrelevant. What matters is where it’s located within the (R, G, B) coordinate space. So before we proceed let’s decompose the image into this new coordinate system and get rid of the actual location of the pixel on the image.
r, g, b = np.array(img).reshape(-1, 3).T
df_rgb = pd.DataFrame({"R": r, "G": g, "B": b}).sample(n=sample_size)
If we look at the pixels in the RGB coordinates, we can then group the ones that are close together and use the average values of the pixels to represent each group — essentially a single color in our palette. For example, if we want to construct a 5-color palette from the enhanced image of Mona Lisa, we need to first look at the distribution of the pixels in the RGB space (here it’s projected into 2D using the PCA algorithm):
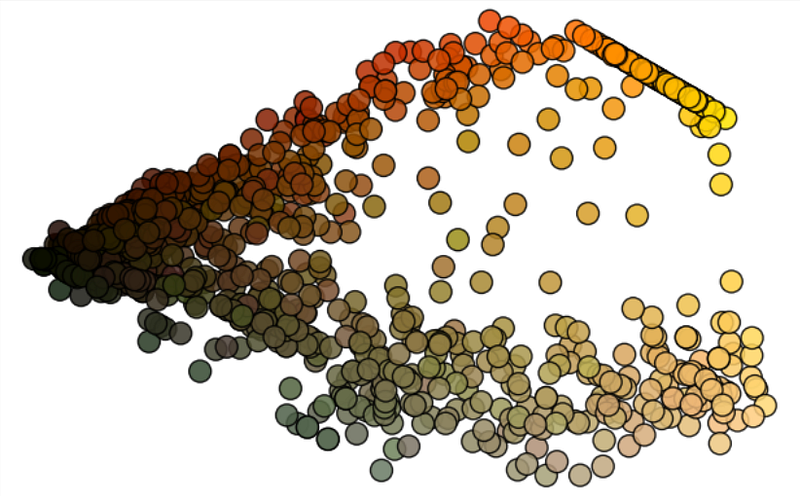
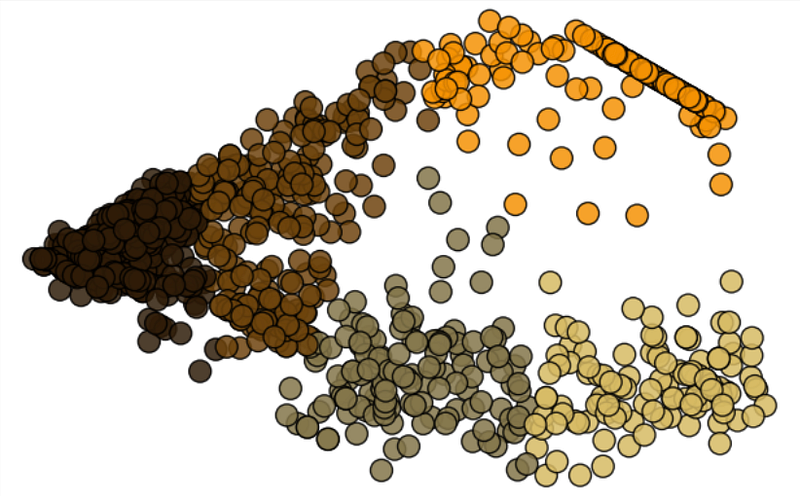
Then we select 5 distinct clusters and assign the average value of each cluster to a slot in our palette.
original sampled pixels assigned to 5 different clusters using K-means algorithm
Obviously, we don’t need to do this by hand. There is a handy machine learning algorithm called K-means clustering that can do this for us in one fell swoop. The only parameter we need to provide is the number of clusters, a.k.a. our palette size. This is what the implementation looks like using sklearn.cluster.KMeans.
from sklearn.cluster import KMeans
palette_size = st.sidebar.number_input("palette size",
                    min_value=1,
                    max_value=20,
                    value=5,
                    step=1,
                    help="Number of colors to infer from the image.")
model = KMeans(n_clusters=palette_size)
clusters = model.fit_predict(df_rgb)

palette = model.cluster_centers_.astype(int).tolist()
And that’s it! We now have our color palette, and we just need to return it to the user on the app.
ℹ️ Although here we used the popular R, G, B decomposition of the pixels, it’s important to note that it’s not the only way to decompose colors. We could have done the clustering of pixels in HSV (Hue, Saturation, Value) space which would have distributed the pixels differently and led to a different color palette.
4. How to use the color picker widget
Somehow, I feel like the subconscious reason I decided to build this app was to use Streamlit’s amazing st.color_picker() widget! The nice thing bout this widget is that you can both show the palette colors inferred from the image, and also change them if you want. This is perfect because as I mentioned earlier, the colors you get back from the app may not be 100% perfect for your particular use case, but only a good starting point. So you may want to change them a little and do a bit of touch-up before actually using it for your visualization.
We don’t want the palette to take up half the page on our app, so let’s put them each in a separate column.
columns = st.columns(palette_size)
for i, col in enumerate(columns):
    with col:
        st.session_state[f"col_{i}"]= \\
				    st.color_picker(label=str(i),
                                    value=palette[i],
                                    key=f"pal_{i}")
						  							value=palette[i],
							  						key=f"pal_{i}")
Beautiful!
One last piece to finish things up, would be to provide the user with a practical end product they can use in their day-to-day work. If a data analyst or data scientist is using this app to infer a color palette, most likely they are going to use it in matplotlib or plotly to apply the palette to their visualization. Why not provide them with a code snippet that takes care of this, so they don’t have to copy-paste every single hex-code from the color palette into their coding environment.
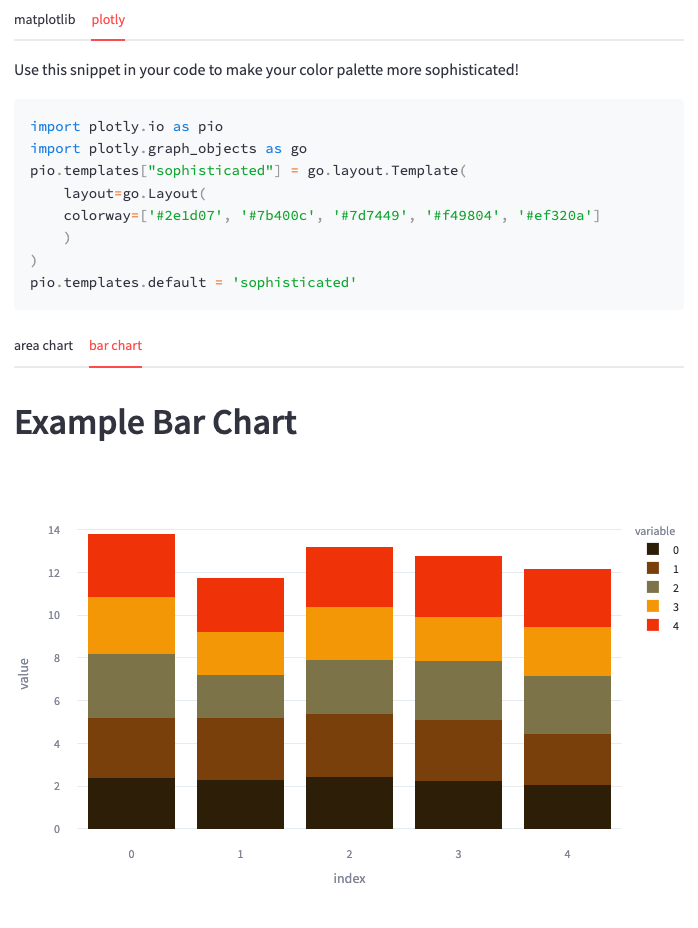
Thanks to Streamlit’s st.code() widget, the whole code block can be copied with a single click!
Wrapping up
There you go! Now you have a fully functional palette inference app that can help you figure out what colors Leonardo Da Vinci used to put that smile on Mona Lisa’s face!
In this post, we covered a lot of Streamlit’s functionalities, especially widgets like st.image, st.tabs, st.file_uploader, st.color_picker. But there is also a lot more that we didn’t cover here for the sake of brevity, so feel free to jump to the source code repo and check out all the details yourself. You can see that I have relied heavily on st.session_state to keep things consistent across multiple runs of the app.
We learned how to
- Construct an image loading component (load pre-existing, upload, or URL download).
- Build an image enhancement component with sliders.
- Cluster pixels together using K-means and use group averages to construct a palette.
- Return the palette to end-user using the color-picker widget.
I had a lot of fun walking you through all these steps, and I really hope you enjoyed reading/skimming through the article and hopefully learned a thing or two.
You can check out the app firsthand, here. I would love to hear your thoughts, questions, comments, and feedback! Get in touch with me on LinkedIn or through my website.
This article was written in collaboration with Ksenia Anske and team Streamlit at Snowflake. See the final version of this article published on Streamlit’s blog here.
All images, unless otherwise noted, are by the author.


