
Using K-Means to Cluster Users and Recommend Similar Trip Destinations
Cool tricks include applying and visualizing the Within Cluster Sum of Squares, Elbow Method, and Silhouette Score

Hey all — it’s been some time since I’ve posted on here, so thought I’d make my comeback with a simple, straightforward machine learning tutorial.
Today, we’re going to:
- Use k-means to cluster users based on the reviews they have left on TripAdvisor.com
- Build a recommender system to suggest destinations to similar users
About the dataset:
Each traveler rating is mapped as Excellent (4), Very Good (3), Average (2), Poor (1), and Terrible (0). The average rating is used against each category per user.
- Attribute 1 : Unique user id
- Attribute 2 : Average user feedback on art galleries
- Attribute 3 : Average user feedback on dance clubs
- Attribute 4 : Average user feedback on juice bars
- Attribute 5 : Average user feedback on restaurants
- Attribute 6 : Average user feedback on museums
- Attribute 7 : Average user feedback on resorts
- Attribute 8 : Average user feedback on parks/picnic spots
- Attribute 9 : Average user feedback on beaches
- Attribute 10 : Average user feedback on theaters
- Attribute 11 : Average user feedback on religious institutions
Click here to get the dataset and see my code on GitHub.
Step 1: Import libraries and load data
import numpy as np, pandas as pd, seaborn as sns, matplotlib.pyplot as plt
%matplotlib inline
ta_data = pd.read_csv('tripadvisor_review.csv')
ta_data.head()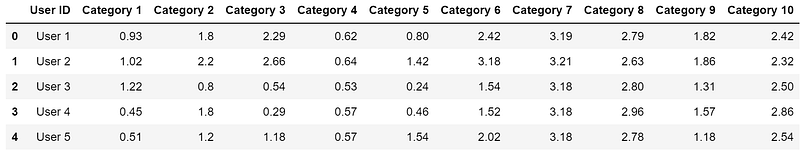
Step 2: Exploratory Data Analysis (EDA)
Note: this is a “quick and dirty” style of EDA. I prefer to do a more in-depth and individualized based approach, so feel free to do so as well.
ta_data.info()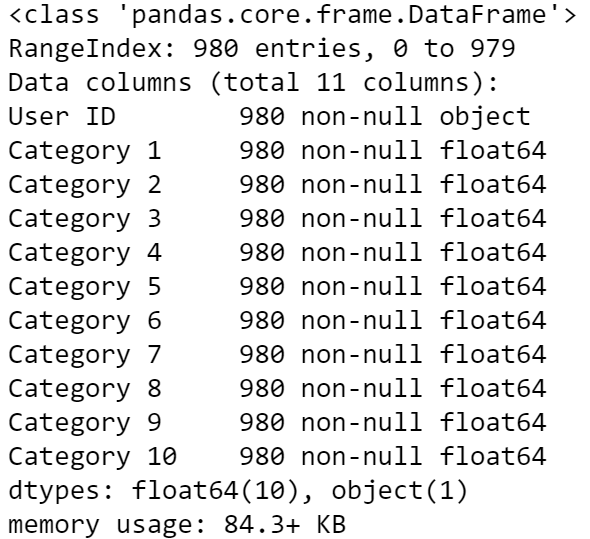
See what I mean by a “simple and straightforward” tutorial now? We have no nulls and none of the inputs to our model are categorical (i.e., no encoding needed).
ta_data.describe()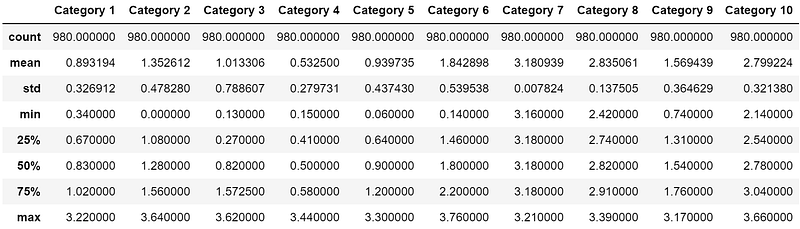
I use .describe() as a glance into whether the dataset is skewed and where it happens. In this case, all categories are in similar scale so there’s no need to apply a transformation.
sns.pairplot(ta_data.drop('User ID', axis=1))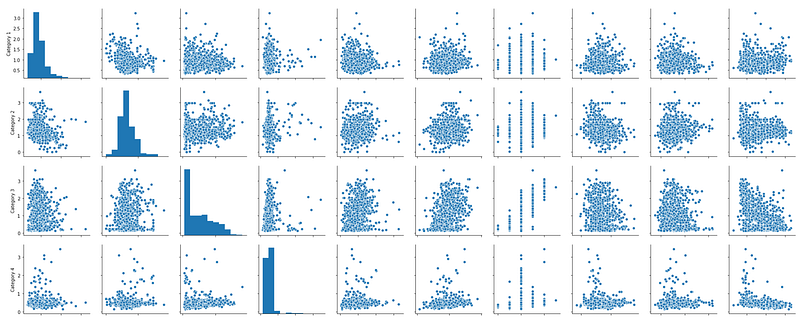
There’s a little bit of skewness going on (hint: look at Category 3 and Category 4), but not a ton of variation in the magnitude of the data. This solidifies our previous decision that a transformation like StandardScaler() from sklearn.preprocessing is unnecessary.
Step 3: Build Model
from sklearn.cluster import KMeansX = ta_data.drop('User ID', axis=1)
X.head()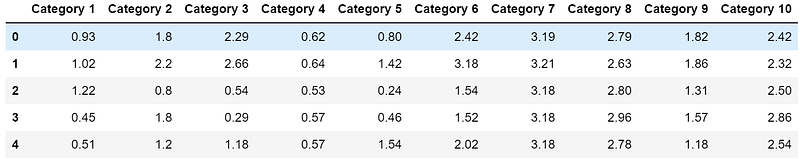
We’re going to start with 2 clusters then optimize.
kmeans = KMeans(n_clusters=2, init='k-means++', random_state=42)
kmeans.fit(X)
Points to note:
- WCSS is called inertia in the K-means algorithm.
- WCSS and Silhouette Score will be explained in further detail below.
So, what WCSS do we get with 2 clusters?
prediction = kmeans.predict(X)
kmeans.inertia_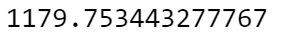
Now take a peak at the silhouette score:
from sklearn import metrics
metrics.silhouette_score(X, prediction)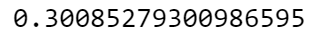
Step 3.1: Calculate the Within Cluster Sum of Squares (WCSS)
- K-means aims to minimize unnormalized variance by assigning points to cluster centers.
- Within Cluster Sum of Squares (WCSS) is a measure of the variability of the observations within each cluster.
Let’s use the elbow method to determine the optimum number of clusters.
wcss = [] # creating an empty listfor i in range(2,20): # for every value from 2 to 19:
kmeans = KMeans(n_clusters=i, init='k-means++', random_state=42)
kmeans.fit(X)
prediction=kmeans.predict(X)
wcss.append(kmeans.inertia_)wcss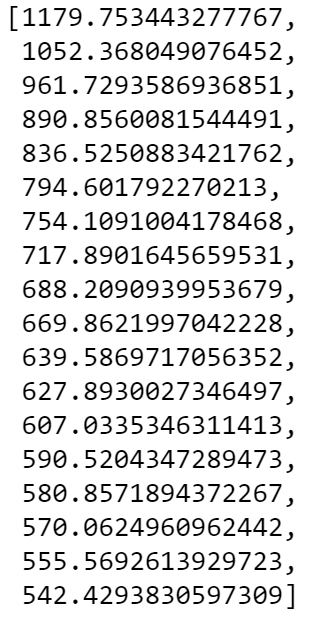
Ok, just a list of numbers. What does this tell us, though?
- Our WCSS for 2 clusters all the way to 19 clusters
- As the number of clusters increase, WCSS decreases
plt.figure(figsize=(12,6))
plt.plot(range(2, 20), wcss, marker='o', c='orchid')
plt.title('The Elbow Method')
plt.xlabel('Number of Clusters')
plt.ylabel('WCSS')
plt.show()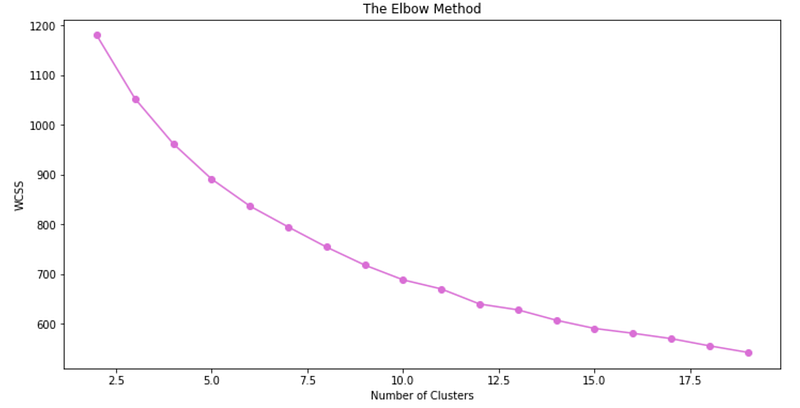
I don’t know about you, but I can’t really tell what the optimum cluster value should be from the elbow method. Let’s try again by visualizing the silhouette scores.
Step 3.2: Calculate the Silhouette Score
Silhouette score is a measure of how similar an object is to its own cluster (cohesion) compared to other clusters (separation). It’s located in the metrics part of sklearn and ranges from [-1,1], where:
- -1 = worst clustering
- +1 = best clustering
s_score = [] # create empty listfor i in range(2, 20): # for each value from 2 to 19:
kmeans = KMeans(n_clusters = i, init = 'k-means++', random_state = 42)
kmeans.fit(X)
pred=kmeans.predict(X)
s_score.append(metrics.silhouette_score(X, pred))s_score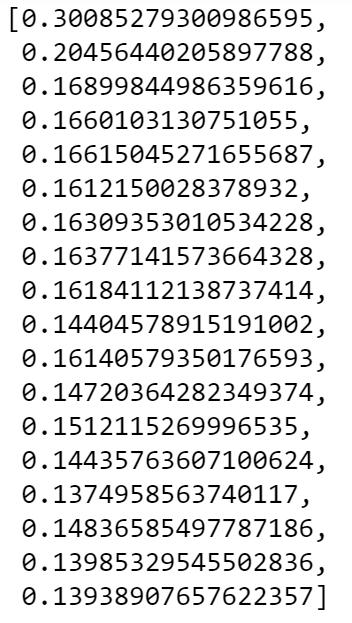
Similar to WCSS, the silhouette scores decrease as the number of clusters increase.
plt.plot(range(2, 20), s_score, marker='o', c='coral')
plt.title('The Silhouette Score')
plt.xlabel('Number of Clusters')
plt.ylabel('Silhouette Score')
plt.show()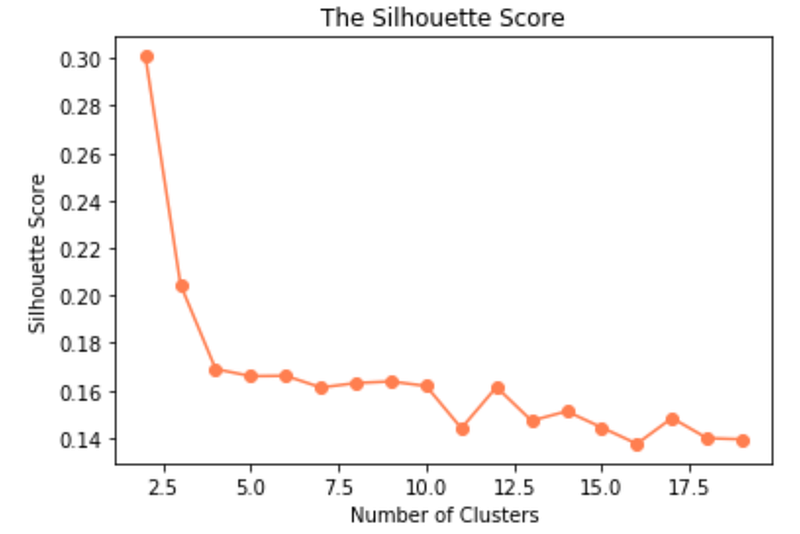
Compared to the elbow method, the silhouette score makes it a bit easier to identify the optimum number of clusters.
The silhouette plot shows that the silhouette coefficient was highest when k = 2.5, suggesting that’s the optimal number of clusters. In other words, the optimal number of clusters is when the Silhouette Score is the highest.
As we can’t have half a cluster, re-fit model with 3 clusters.
kmeans = KMeans(n_clusters = 3, init = ‘k-means++’, random_state = 42)# check out each cluster label
kmeans.fit(X)
pred = kmeans.predict(X)
pred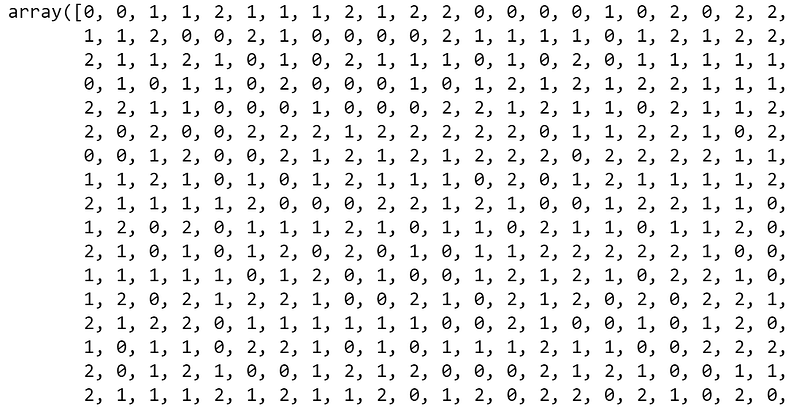
Now, add those cluster labels back to the original dataframe:
ta_data['Cluster'] = pred
ta_data.head()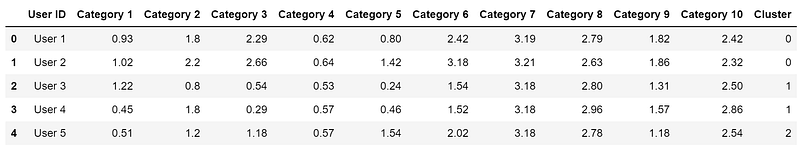
How many users are in each cluster?
ta_data['Cluster'].value_counts()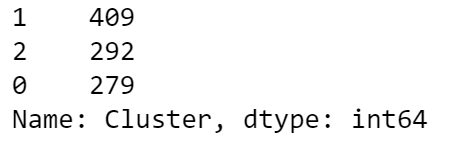
Counts don’t mean much to me, so what’s the percent breakdown of users in each cluster?
- 28% of users are assigned to Cluster 0
- 42% of users are assigned to Cluster 1
- 30% of users are assigned to Cluster 2
Step 4: Build the Recommendation System
Create a recommendation function that will take 2 User IDs (e.g. recommend(“User 1”, “User 2”)) as input and will return “Yes” or “No” to the question on whether we can recommend the destinations User 2 likes to User 1.
def user_recommendation(firstid, secondid):

    # first user ID
    row_firstuser = ta_data.loc[ta_data['User ID']==firstid]
    cluster_firstuser = row_firstuser['Cluster'].item()

    # second user ID
    row_seconduser = ta_data.loc[ta_data['User ID']==secondid]
    cluster_seconduser = row_seconduser['Cluster'].item()

    if cluster_firstuser == cluster_seconduser:
        return 'Yes'
    else:
        return 'No'
Question 1
For User 8, is it better to suggest the destinations User 28 likes or the destinations User 29 likes?
user_recommendation('User 8','User 28') # -> 'No'
user_recommendation('User 8','User 29') # -> 'Yes'
For User 8, it would be better to suggest destinations that User 29 likes.
Question 2
For User 11, is it better to suggest the destinations User 16 likes or the destinations User 28 likes?
user_recommendation('User 11','User 16') # -> 'No'
user_recommendation('User 11','User 28') # -> 'Yes'
For User 11, it would be better to suggest destinations User 28 likes.
Step 5: Validate the Recommendation System
Our recommendations can be verified by manually checking which cluster each user is in. Remember the goal is to recommend destinations to users who are in the same cluster. In other words, users that are clustered together are seen as more similar to each other than to users in other clusters, which means there’s a higher probability that they would also like a destination that a user in the same cluster likes.
# question 1 verification
user = ['User 8', 'User 28', 'User 29']
for x in user:
userid = ta_data.loc[ta_data['User ID']==x]
cluster_user = userid['Cluster'].item()
print(f'{x} is in cluster number: {cluster_user}')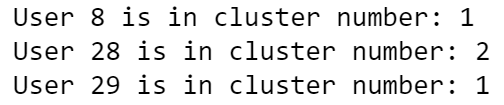
# question 2 verification
user = ['User 11', 'User 16', 'User 28']
for x in user:
userid = ta_data.loc[ta_data['User ID']==x]
cluster_user = userid['Cluster'].item()
print(f'{x} is in cluster number: {cluster_user}')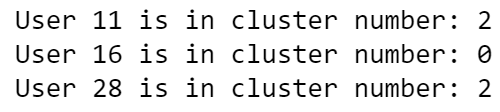
Conclusion
After comparing the elbow method, WCSS, and silhouette scores, we found that the optimum number of clusters for this dataset was 3 clusters and that Cluster 1 had the highest proportion of users. We then built a simple destination recommendation function that outputs which user’s interests are more closely aligned with another user. Finally, we verified that our recommender was working by checking which clusters each user was in.
Author Note
Thanks for reading! Please feel free to follow me on Medium and LinkedIn. I’d love to continue the conversation and hear your thoughts/suggestions.
-Mo