
Using K-means Clustering to Create Support and Resistance:

Note from Towards Data Science’s editors: While we allow independent authors to publish articles in accordance with our rules and guidelines, we do not endorse each author’s contribution. You should not rely on an author’s works without seeking professional advice. See our Reader Terms for details.
Support and resistance are some of the most talked-about concepts when it comes to technical analysis. Support and resistance are used as price barriers, in which the price “bounces” off of. In this article, I will use the K-means clustering algorithm to find these different support and resistance channels, and trade with these insights.
Support and Resistance:
To understand how best to implement something, we should first understand the thing that we want to implement.
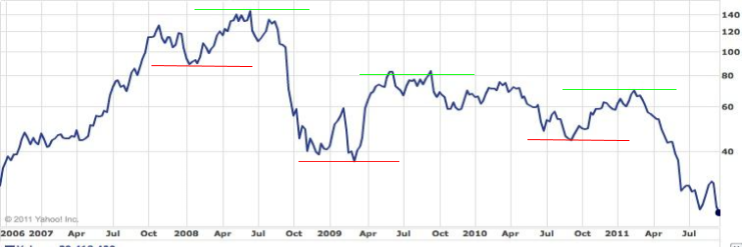
Support and Resistance, are two lines that are drawn on a graph, to form a channel, in which the price exists within.
Support and resistance are resultant of a security not being able to decrease or increase anymore, due to pressure from sellers or buyers. A good rule of thumb is that the more times a price is deflected against a support or resistance line, the less likely it will work again.
Support and resistance give good insight into entry points and selling points, as the support and resistance lines are theoretically the lowest and highest points for that limited time period.
Downsides of the support and resistance strategy is that it works for an unknown period of time, and the lines are subjective and are therefore subject to human error.
Program Concept:
The K-means clustering algorithm, finds different sections of the time series data, and groups them into a defined number of groups. This number (K) can be optimized. The highest and lowest value of each group is then defined as the support and resistance values for the cluster.
Now that we know how the program is intended, let’s try to recreate it in Python!
The Code:
import yfinance
df = yfinance.download('AAPL','2013-1-1','2020-1-1')
X = np.array(df['Close'])
This script is to access data for the Apple stock price. For this example, we are implementing the support and resistance only on the closing price.
from sklearn.cluster import KMeans
import numpy as np
from kneed import DataGenerator, KneeLocator

sum_of_squared_distances = []
K = range(1,15)
for k in K:
    km = KMeans(n_clusters=k)
    km = km.fit(X.reshape(-1,1))
    sum_of_squared_distances.append(km.inertia_)
kn = KneeLocator(K, sum_of_squared_distances,S=1.0, curve="convex", direction="decreasing")
kn.plot_knee()
# plt.plot(sum_of_squared_distances)
This script is to test the different values of K to find the best value:
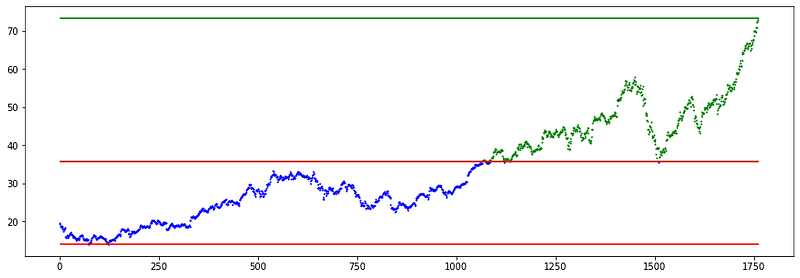
The K-value of 2 creates support and resistance lines that will never be reached for a long time.
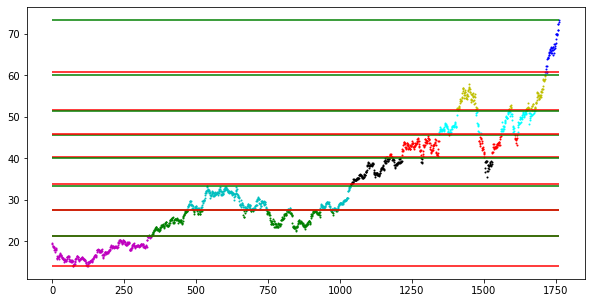
A K-value of 9 creates support and resistance that are far too common and make it difficult to make predictions.
Therefore, we have to find the best value of K, calculated by the elbow point when comparing variance between K values. The elbow point is the biggest improvement, given a certain movement.
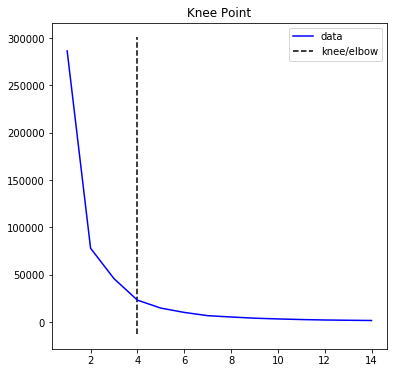
Based on the kneed library, the elbow point is at 4. This means that the optimum K value is 4.
kmeans = KMeans(n_clusters= kn.knee).fit(X.reshape(-1,1))
c = kmeans.predict(X.reshape(-1,1))
minmax = []
for i in range(kn.knee):
    minmax.append([-np.inf,np.inf])
for i in range(len(X)):
    cluster = c[i]
    if X[i] > minmax[cluster][0]:
        minmax[cluster][0] = X[i]
    if X[i] < minmax[cluster][1]:
        minmax[cluster][1] = X[i]
This script finds the minimum and maximum value for the points that reside in each cluster. These, when plotted, become the support and resistance lines.
from matplotlib import pyplot as plt
for i in range(len(X)):
    colors = ['b','g','r','c','m','y','k','w']
    c = kmeans.predict(X[i].reshape(-1,1))[0]
    color = colors[c]
    plt.scatter(i,X[i],c = color,s = 1)
for i in range(len(minmax)):
plt.hlines(minmax[i][0],xmin = 0,xmax = len(X),colors = 'g')
plt.hlines(minmax[i][1],xmin = 0,xmax = len(X),colors = 'r')This script plots the support and resistance, along with the actual graph of the prices, which are color coded based on the cluster. Unfortunately, I think that the colors are limited, meaning that there is a limited K value in which the data can be color coded.
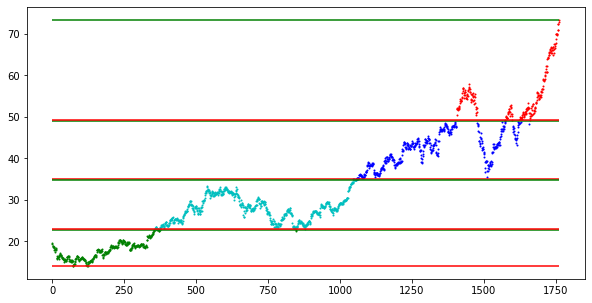
This is the result of the program, a set of support and resistance lines. Keep in mind that the lines are most accurate, when the values fall back into the channel. Additionally, the final resistance line would be the least accurate ,as it takes the last value into account, without considering any other values.
My links:
If you want to see more of my content, click this link.


