
Using graphs to model and analyze the customer journey
A conceptual guide to getting started
In today’s landscape of voluminous data, complex customer interactions, and Machine Learning models (for recommendations and propensities), understanding the customer journey is paramount for ultimate business success. Traditional databases are an option for supporting this understanding — but at some point, they lack the efficiency to do so in a simple manner and at scale.
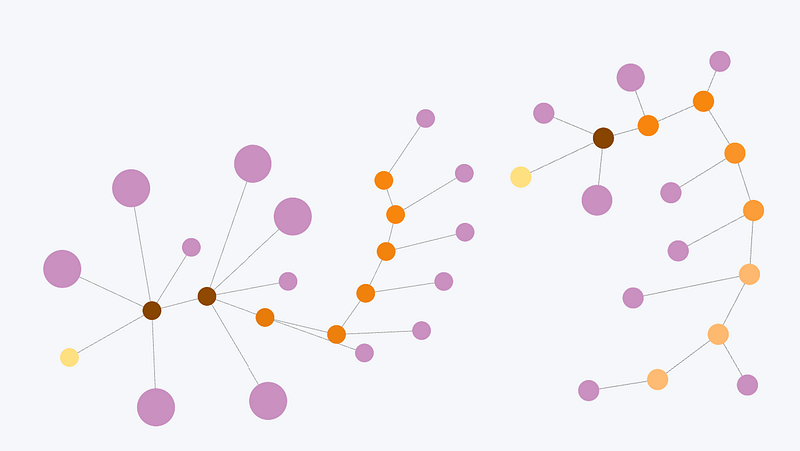
Graph technology has become a more suitable and powerful option to promote this understanding, its growth being driven by the affordability and improvement of cloud computing and related technology. Graphs are undoubtedly the choice for modeling and visualizing complex data and relationships.
The goal of this article is to help you and your business start thinking about how graphs can be used to understand the journey among your customers. The information presented here is not meant to serve as an in-depth guide for building a graph platform — that will come later in this multi-article series. Instead, conceptual details are presented, and some high-level code is shared.
By leveraging a graph structure and moving to an unstructured format for our customer journey data and relationships, our team has been able to identify and explore the actions of highly engaged customers to find paths and patterns that we have used to assist other customers in their experience. Additionally, while doing this work, we learned how to reduce query time to gain faster insights — by a multiple of 100 in some cases compared to our existing relational table–structured platforms.
We used a Neo4j graph database to build this customer journey platform, but it is not the only technology available. Several alternatives exist, including some products from Microsoft. Ultimately, the choice depends on the specific business case and requirements.
What are “graphs”?
Graphs are a data structure concept with two main components:
- Nodes represent objects (when labeled as such).
- Relationships (sometimes referred to as “edges”) represent the type and direction of a relationship between nodes.
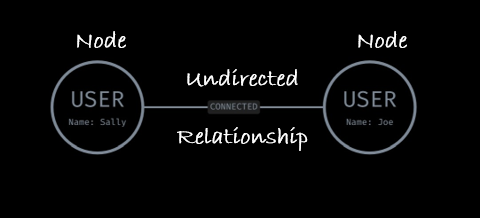
Relationships are important because they determine how the graph can be traversed, or how a search query can navigate the graph to find the desired data. Relationships have two types of orientations. The first is undirected, i.e., there is no specific direction. An example is the LinkedIn graph, specifically the connection between professionals. In this case, when a member “connects” with another, what results is a mutual, undirected relationship.
The other type of relationship is directed, i.e., the relationship goes only from Node A to Node B. A great example of this is another social network: Instagram. In this product, users don’t have to mutually connect or follow each other. Therefore, the direction of the relationship is important, i.e., Sally can follow Joe, but Joe doesn’t have to follow Sally back (rude).
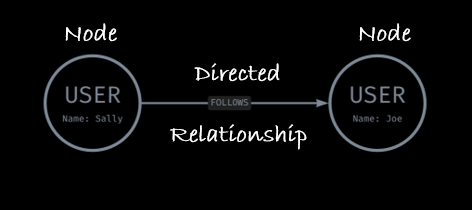
As the field of graph tooling evolves, it has become increasingly common to include a third component: properties for nodes and relationships. These are metadata providing further information about the entity (e.g., name or userID) or relationship (e.g., date, weight). In the examples above, the nodes include one property, “Name”, informing the person querying the graph that the two nodes are Sally and Joe.
To continue to explore the basics of graph structure further, check out this resource.
Graph technology
There are plenty of graph technologies out there — more than can be listed in this article. They can be categorized into three types:
- Graph packages that provide the capability to build an in-memory graph. Some examples include NetworkX and Spark GraphFrames. Some of the features for these packages, however, such as properties, user-friendly querying, and visualizations, can be limited.
- Graph databases that are like traditional databases (e.g., SQL), but exist in a graph structure. These provide the benefit of persistent data storage, which means the graph doesn’t have to live in memory. Some leaders in the space — including Neo4j and TigerGraph — also maintain their own query language that is intuitive to pick up.
- Graph as a Service, like graph databases, but without the complexity of hosting and maintenance. Neo4j and others are increasingly building such capabilities into their product offerings.
Microsoft has a long history of leveraging graph technology to solve problems (for example, see the Bing Graph API). Microsoft has even dabbled in the development of its own graph products, including the Microsoft Graph.
For our customer journey problem, we decided to leverage Neo4j. However, the principles we explore in this article could be applied to any graph that allows for a multi-partite graph at scale.
What is the customer journey?
Before continuing into how we’ve used graphs to derive insights from the customer journey, let’s quickly discuss what we mean by “customer journey.”
Gartner defines “customer journey” as a tool to understand the series of connected experiences that customers desire and need — whether that involves completing a desired task or traversing the end-to-end journey from prospect to customer to loyal advocate. Microsoft Dynamics 365 Customer Insights describes it as follows:
A customer journey is the end-to-end experience a customer has with your brand or business. When you create a successful customer journey, you’re able to reduce costs, increase revenue, and establish and nurture customer loyalty.
The customer journey is not merely a marketing tool — it is also a source of multifaceted insights. It plays an important role in how we improve the customer experience, architect customer profiles, and ultimately grow our business as we serve our customers.
Simplifying these definitions, we can define the term “customer journey” as:
The sequential behaviors taken toward growth milestones with Microsoft products.
The key components are all there: The chronology, the behaviors, and the growth milestones of interest (e.g., product adoption or increased usage). All three are important for understanding the journey, inferring intention, context, urgency, and the customer’s maturity within products and experiences.
A note about compliance
At Microsoft, we put customer considerations at the center of how we use data. This is because a.) our company insists on respect for, privacy of, and security of user data, and b.) laws and regulations govern data usage.
It’s important to know the compliance and privacy requirements that apply within your organization. Seek out subject matter experts who can help determine the necessary processes and security protocols to follow. If you don’t have such experts, consider becoming one yourself!
Starting to graph the customer journey
Constructing the customer journey is a complex and connected undertaking, especially in this age of big data and web-based businesses. Fortunately, graphs are often suitable for customer journey–related problems. Compared to relational databases, graphs tend to be more flexible and perform well (up to 100 times faster) when it comes to highly connected data. The explicit focus placed on relationships between data points makes deep traversal of the connections easier and often more effective at uncovering complex patterns.
In building a graph, it’s important to have one or more questions in mind. What is the graph meant to help answer? Who is this answer for? Start with three to five primary questions and continually check in with the graph model to make sure they are easily answerable.
Initially, the primary questions we were attempting to answer with the Neo4j graph technology included:
- What are the behaviors users perform before signing up for a trial?
- Are there certain behaviors that appear to cause more friction (i.e., a longer time between successive behaviors)?
- What is the time frame between the first behavior and successful sign-up for a trial?
- Is there a difference in behaviors between those who signed up and those who ultimately did not?
We found inspiration for our graph data model in this patient journey graph data model: Modeling Patient Journeys with Neo4j | by Matt Holford | Neo4j Developer Blog | Medium.
The data
Building a customer journey graph requires behavioral data, e.g., product usage, click streams, marketing interactions, and so on. For the greatest success, start with one category of behavioral data. Once the set of primary questions are answered for this area, incorporate another one.
This example can be applied across categories of behavioral data because it focuses on four things — who did what on when and how often. The “where” is answered by the chosen category (e.g., in product A or on website B).
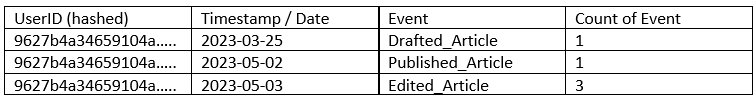
The granularity of the data depends on the particular use case and specificity of the question. Again, start simple and build in more complexity. The customer journey example explained in this section started with data aggregated at a [user] + [date] + [event type] grain. An example table of how the base data might look for a website is included below. This tabular data would then be conformed into a graph format, with some derived data (e.g., “Day”) calculated before ingestion into the database.
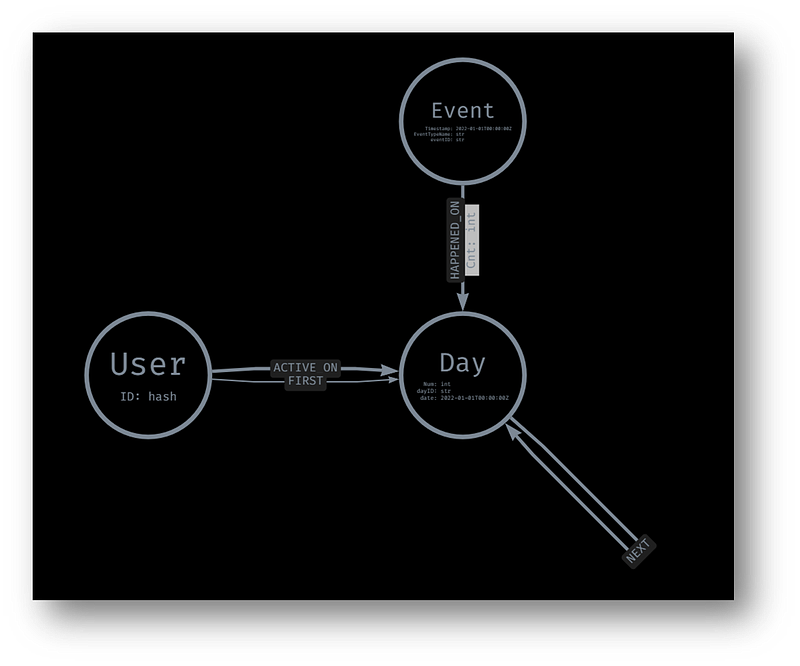
Nodes
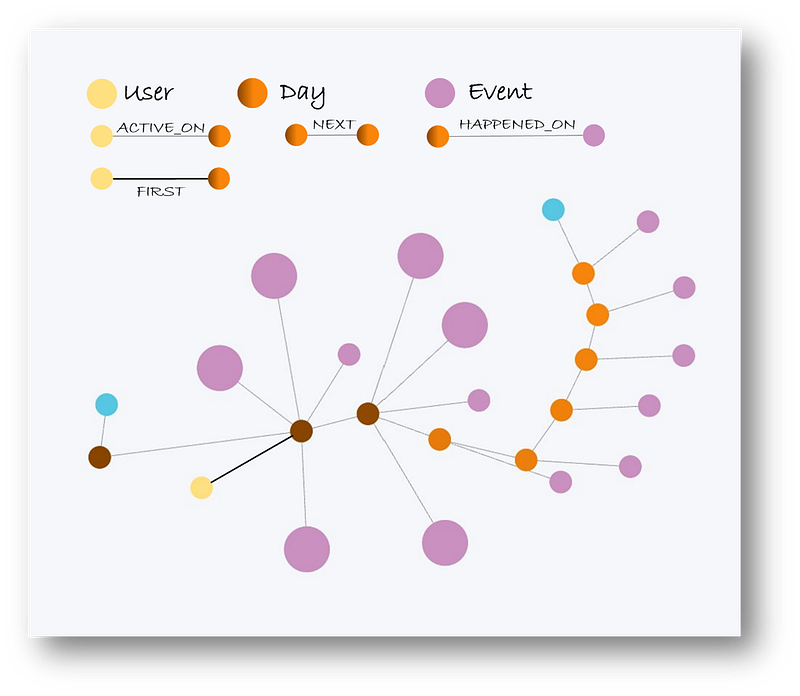
With the above base data in mind, three different nodes are built into the customer journey graph:
- User: The entity or user performing the event.
// Neo4j Cypher Query Language
USING PERIODIC COMMIT 500
LOAD CSV WITH HEADERS
FROM '{STORAGE_URL}' AS row
MERGE (u:User {userID:toUpper(row.UserID)})
SET u.firstUsageDate = datetime(replace(row.firstUsageDate,' ','T'))
RETURN count(u)- Day: The point in time at which the event took place. It is best if this entity is normalized against an anchor point. For example, the day of publishing the article, the first day of drafting or using the website, or some other important start date. In this case, we normalized it to a “relative day since first usage” and stored it as a node property.
// Neo4j Cypher Query Language
USING PERIODIC COMMIT 500
LOAD CSV WITH HEADERS
FROM '{STORAGE_URL}' AS row
MERGE (d:Day {dayID: toUpper(row.dayID)})
ON CREATE SET d.Num = row.DayNum
RETURN d- Event: The type of behavior performed, stored as a property. There is another property, “cnt”, which indicates how often the particular event occurred on the relevant day.
// Neo4j Cypher Query Language
USING PERIODIC COMMIT 500
LOAD CSV WITH HEADERS
FROM '{STORAGE_URL}' AS row
MERGE (e:Event {eventID:toUpper(row.eventID)})
ON CREATE SET
  e.Timestamp = datetime(replace(row.Timestamp," ","T")),
  e.EventTypeName = row.EventTypeName,
  e.Completions = toInteger(row. Completions)
RETURN e
Each node has a unique identifier. This means that the same event type, for example, appears across multiples unique nodes — the same for the Day node.
The size of data typically used for customer journey graphs and analyses is very large. Therefore, there is a high risk of super nodes, which decrease query performance. For example, without unique identifiers, hundreds of thousands of dates would be connected to the same event. If a query is executed that requires these relationships and nodes, it would need to traverse the path hundreds of thousands of times. It most cases, there are better ways to model this information.
Relationships
There are four types of relationships in our basic customer journey graph.
- ACTIVE_ON: Connects the User node with the Day node. This helps determine when users were performing behaviors. This relationship is also used in conjunction with apoc.periodic.iterate() to create new relationships for FIRST and NEXT.
// Neo4j Cypher Query Language
USING PERIODIC COMMIT 500
LOAD CSV WITH HEADERS
FROM '{STORAGE_URL}' AS row
MATCH (u:User {userID:toUpper(row.UserID)})
MATCH (d:Day {dayID: toUpper(row.dayID)})
WITH u, d
MERGE (u)-[rel:ACTIVE_ON]->(d)
RETURN count(rel)- HAPPENED_ON: Connects the Event node with the Day node. This helps determine which events happened on days of activity.
// Neo4j Cypher Query Language
USING PERIODIC COMMIT 500
LOAD CSV WITH HEADERS
FROM '{STORAGE_URL}' AS row
MATCH (e:Event {eventID:toUpper(row.eventID)})
MATCH (d:Day {dayID: toUpper(row.dayID)})
WITH e, d
MERGE (e)-[rel:HAPPENED_ON]->(d)
RETURN count(rel)- FIRST: Connects each user with their very first Day of usage.
// Neo4j Cypher Query Language
CALL apoc.periodic.iterate(
  'MATCH (u:User) RETURN u',
  'MATCH (u)-[:HAS_EVENT]->(e:Event)
    WITH u, e
    ORDER BY e.Timestamp
    WITH u, collect(e) AS events
    WITH u, events[0] AS firstEvent
    CREATE (u)-[:FIRST_EVENT]->(firstEvent)',
{iterateList:false, batchSize:500});- NEXT: Connects each Day with the following Day of activity. This relationship is important in modeling the chronology of customer activity — and ultimately the customer journey, dynamically analyzing activity between two time points, and helping build queries for visualizing the customer journey.
CALL apoc.periodic.iterate(
  'MATCH (u:User) RETURN u',
  'MATCH (u)-[:"""+rel+"""]->(d:"""+node+""")
    WITH d
    ORDER BY d.Num
    WITH collect(d) AS nodes
    WITH nodes, nodes[1..] as nextNodes
    UNWIND range(0,size(nextNodes)-1,1) as index
    WITH nodes[index] as first, nextNodes[index] as second
    CREATE (first)-[:NEXT]->(second)',
{iterateList:false, batchSize:500});
Using this rather simple graph data model, we can answer the primary questions outlined above and more. For example, within the customer journey pertaining to one particular product, the first day experience is incredibly important to the customer’s continued engagement. Furthermore, there are one or two specific behaviors that lead to a 200 percent increase in chance of ultimately purchasing the product. These types of insights are key in finding areas of optimization and experimentation to drive better experiences and product growth.
This approach is flexible enough that it can incorporate multiple event types, customer information (as nodes or properties), a longer user history, and even activity across domains (e.g., products). Likewise, it offers a dynamic view of the overall customer journey, instead of being specific to a single milestone (e.g., trial sign up or purchase). Data scientists — and perhaps even less technical people — can easily switch focus to other parts of the journey (e.g., retention, returning after the first day, post–30 days of first usage, and so on).
Here is an example of one user’s journey from their first day of trial usage to purchasing the product:
This is only scratching the surface. Upcoming articles in this series will dive more deeply into:
- The technical cloud infrastructure required to run this graph.
- Leveraging graph algorithms, node similarity, and FastRP embeddings to find similar customer journeys and propensities.
- Building a fabric and metadata graph structure to scale.
- and more!
Jacob H. Marquez is on LinkedIn.


