
Use This Ensemble Machine Learning Model With Your Time Series
CatBoost’s Magic Wand: Predicting Data with Confidence

Machine learning algorithms are numerous. Many are useful in predicting time series data. This article explores an ensemble learning model called CatBoost, and shows how to use it with time series.
Introduction to CatBoost
CatBoost or Categorical Boosting is a robust open-source gradient boosting library developed by Yandex for machine learning tasks, particularly regression and classification.
It’s distinguished by its ability to efficiently handle categorical features, a common challenge in real-world datasets, without requiring extensive preprocessing. CatBoost employs innovative techniques like target encoding and ordered boosting for this purpose.
Notably, it excels in preventing overfitting through a combination of strategies like ordered boosting and depth-first search, making it a reliable choice for generalization.
✨ Important note
Overfitting happens when a machine learning model learns the training data too well. It’s like studying only the questions you’ve seen before for an exam without understanding the concepts behind them.
So, when new data comes in, the model may perform poorly because it’s too specialized in the training data and can’t generalize well. Think of it as memorizing instead of truly understanding.
Despite its capabilities, CatBoost remains fast in terms of training, often outperforming other gradient boosting implementations. Additionally, CatBoost provides tools for model interpretability, aiding in the understanding and explanation of feature importance, further enhancing its appeal for both beginners and experienced professionals in the field.
The name CatBoost is derived from its focus on categorical features “Cat” and its use of gradient boosting “Boost” techniques.
If you want to see more of my work, you can visit my website for the books catalogue by simply following the link attached the picture:

Using CatBoost to Predict Time Series Data
The main aim of this article is to write a Python code that uses CatBoost to predict the returns of the S&P 500 index using its lagged returns.
The plan of attack is as follows:
- Import the S&P 500 prices into Python and difference them (in order to make them stationary).
- Split the data into training and testing (with training data covering 95% of the whole set).
- Fit the model to the training data and predict on the test data. The features used are the last 50 returns of the index.
- Evaluate the mode using a simple hit ratio and chart the predicted values.
✨ Important note
Stationary time series data is like a ride on a smooth highway with no bumps or curves. In this context, it means that the statistical properties of the data like mean and variance stay constant over time. This makes it easier to analyze and predict because there are no big surprises or unexpected changes popping up as you move along the timeline.
Use the following code to create the algorithm:
import numpy as np
from catboost import CatBoostRegressor
import matplotlib.pyplot as plt
import pandas_datareader as pdr

def data_preprocessing(data, num_lags, train_test_split):

    # Prepare the data for training
    x = []
    y = []
    for i in range(len(data) - num_lags):
        x.append(data[i:i + num_lags])
        y.append(data[i+ num_lags])

    # Convert the data to numpy arrays
    x = np.array(x)
    y = np.array(y)

    # Split the data into training and testing sets
    split_index = int(train_test_split * len(x))
    x_train = x[:split_index]
    y_train = y[:split_index]
    x_test = x[split_index:]
    y_test = y[split_index:]

    return x_train, y_train, x_test, y_test

start_date = '1960-01-01'
end_date   = '2023-09-01'

# Set the time index if it's not already set
data = (pdr.get_data_fred('SP500', start = start_date, end = end_date).dropna())

# Perform differencing to make the data stationary
data_diff = data.diff().dropna()
data_diff = np.reshape(np.array(data_diff), (-1))
x_train, y_train, x_test, y_test = data_preprocessing(data_diff, 50, 0.95)

# Create a CatBoostRegressor model
model = CatBoostRegressor(iterations = 100, learning_rate = 0.1, depth = 6, loss_function = 'RMSE')

# Fit the model to the data
model.fit(x_train, y_train)

# Predict on the same data used for training
y_pred = model.predict(x_test)

# Plot the original sine wave and the predicted values
plt.plot(y_pred, label='Predicted Data', linestyle='--')
plt.plot(y_test, label='True Data')
plt.legend()
plt.grid()

# Calculating the Hit Ratio
same_sign_count = np.sum(np.sign(y_pred) == np.sign(y_test)) / len(y_test) * 100
print('Hit Ratio = ', same_sign_count, '%')
The following Figure shows a comparison between true and predicted data.
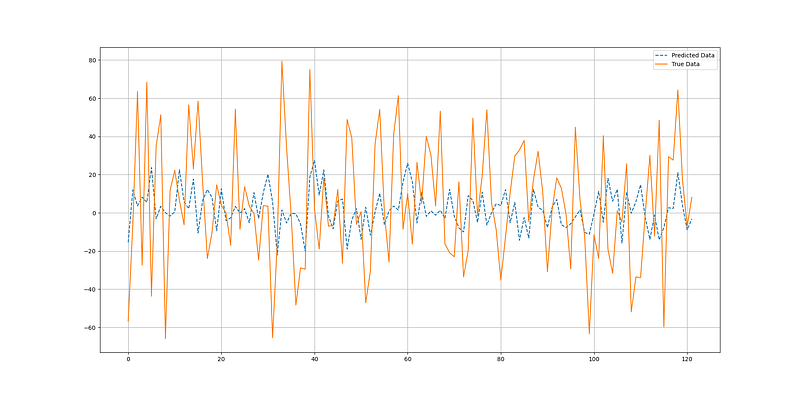
The output of the code is as follows:
Hit Ratio = 59.01 %It seems like the algorithm does a not so bad job at predicting the returns. Still, this needs more investigation and research, especially with the long-short bias, as the returns of the S&P 500 are inherently skewed on the positive side given the bullish nature of the stock market.
Therefore, a global hit ratio of 59.01% does not mean much if not decomposed in the bullish hit ratio and the bearish hit ratio.


