
Use These 3 Chrome Extensions To Get Better Medium Stats
Curation tags, better dashboards, and visualization

In the almost two years that I’ve been publishing my content on Medium, the platform has gone through many changes and visual updates. But the statistics page hasn’t changed much.
The page might look great and clean, it’s accessible on mobile and all that but I can’t do some analysis on my content.
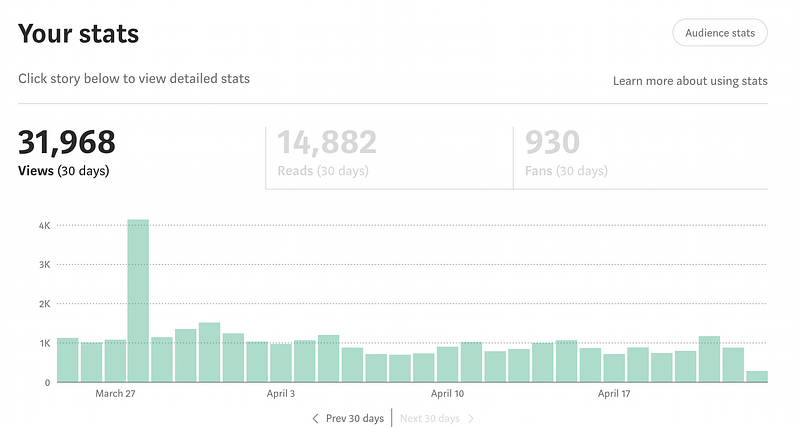
When we now take a look at the stats, we see a good-looking overview of our views, reads, and fans per 30 days.
If we look further down.
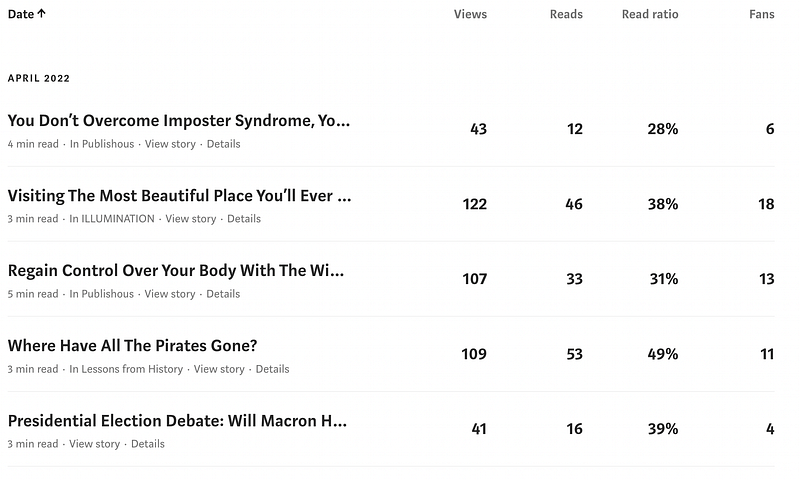
We see these categories per story, including a read ratio. But it isn’t much data to look at — medium even removed the curated topics from the story stats pages.
But I’ve got three brilliant Google Chrome Exentions that improve your medium stats.
1. Medium Curated Topics
When around 2020/2021, Medium got rid of their ‘Curation’, they didn’t get rid of curation. It got changed to ‘further distribution’. But it’s still a kind of curation.
With categories appointed to your story. But we can’t see them anymore.
Not without an external extension.
With Medium Curated Topics, created by Mariana Vargas, you can add the tags back to your story stats page.
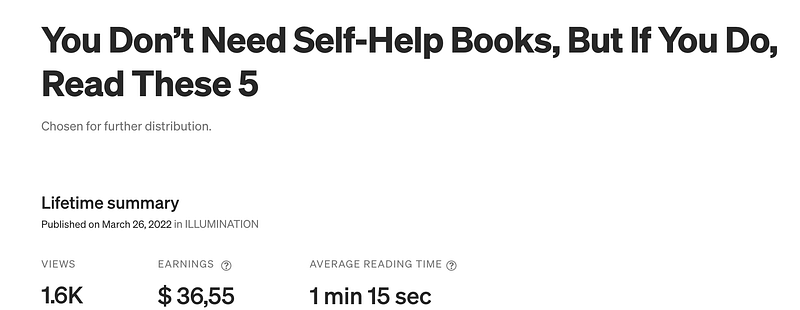
It says ‘Chosen for further distribution’. After you’ve installed the plugin for chrome. You see this.
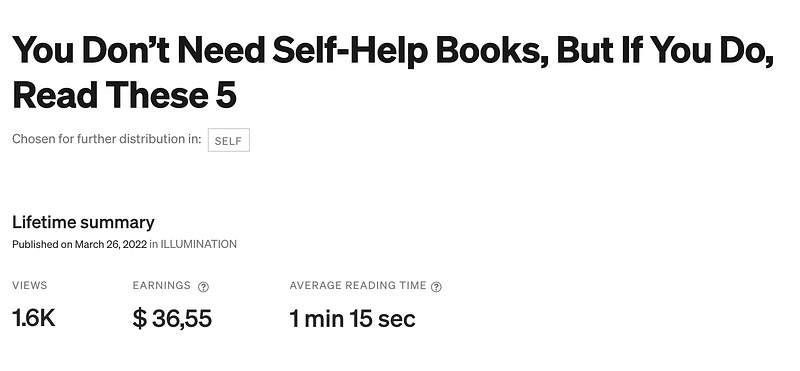
You see the topic it was distributed in.
2. Fractions, Medium Dashboard
This is a new one, but it’s looking so good. You can now download this extension for several browsers and its developer is highly active on it.
Fractions is the new Medium dashboard, made by Can Durmus.
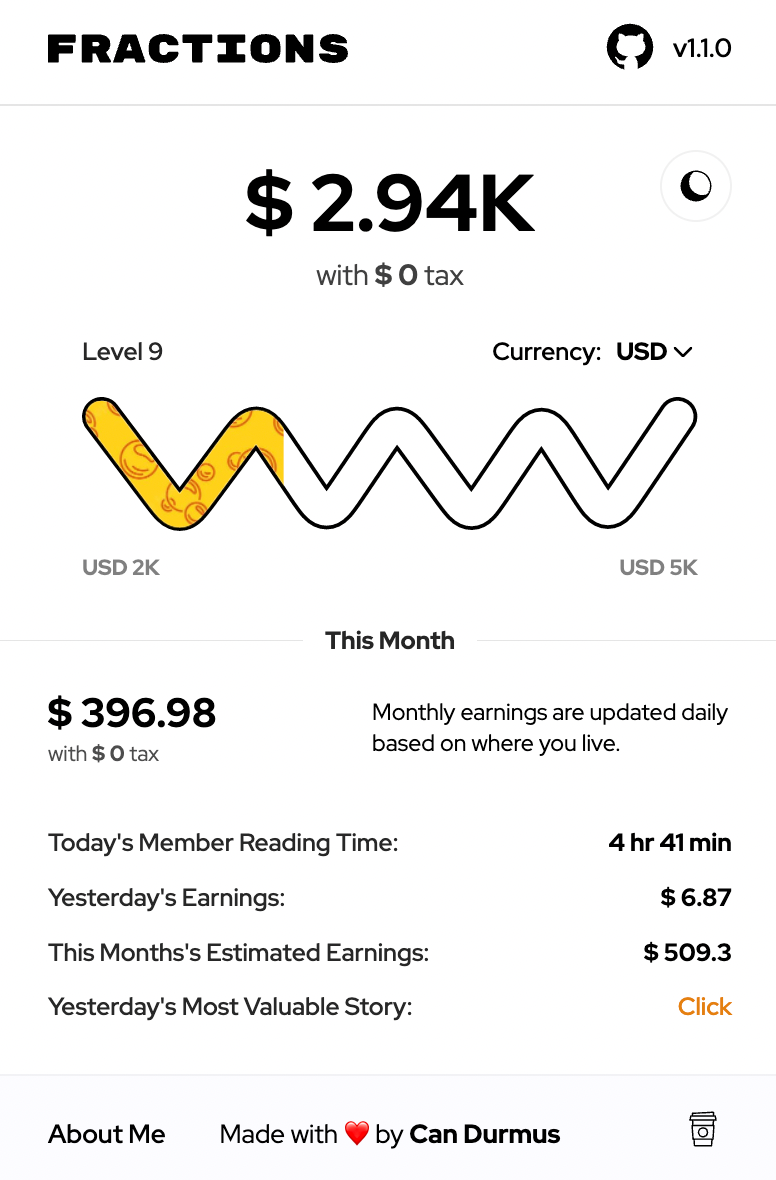
You can see the total amount of money that you’ve earned on the top and even select your preferred currency.
One of the things that I like the most about the plugin, is that you can view your most valuable story of yesterday and the whole month.
And it predicts what you’ll earn in the month.
3. Medium Next Generation Stats
Just a quick disclaimer before you’ll download this — it’s a heavy extension and not every computer can handle this one. But if you do, it’s quite amazing.
You can download the plugin here.
It will generate a whole new medium stats dashboard inside the browser page. It’s a visualization and analytical view of your stories and you can filter them per 30–1800 days.
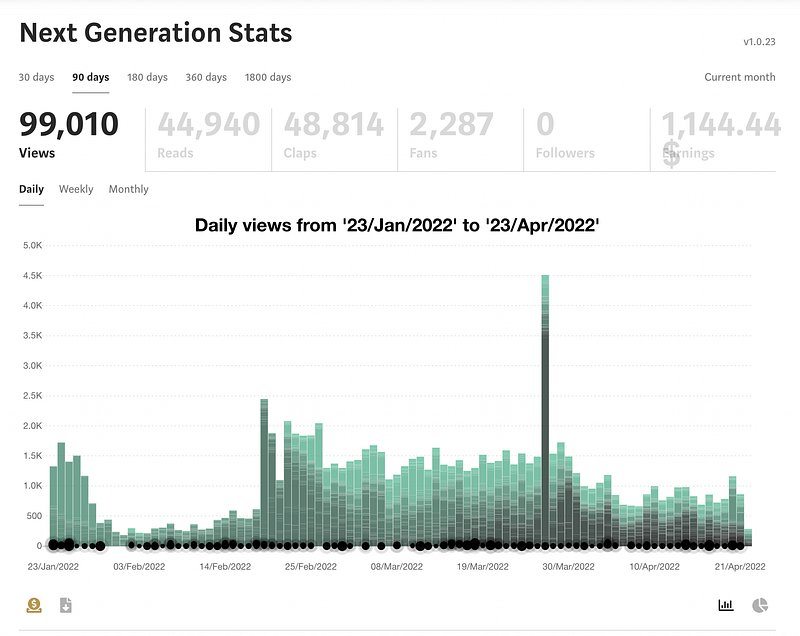
It’s so pretty and as you look at the top of the page, you’ll be able to view the number of views, reads, claps, fans, and earnings from a certain period in time.
The follower count doesn’t seem to work, unfortunately. You can export the data and use it on your own as well.
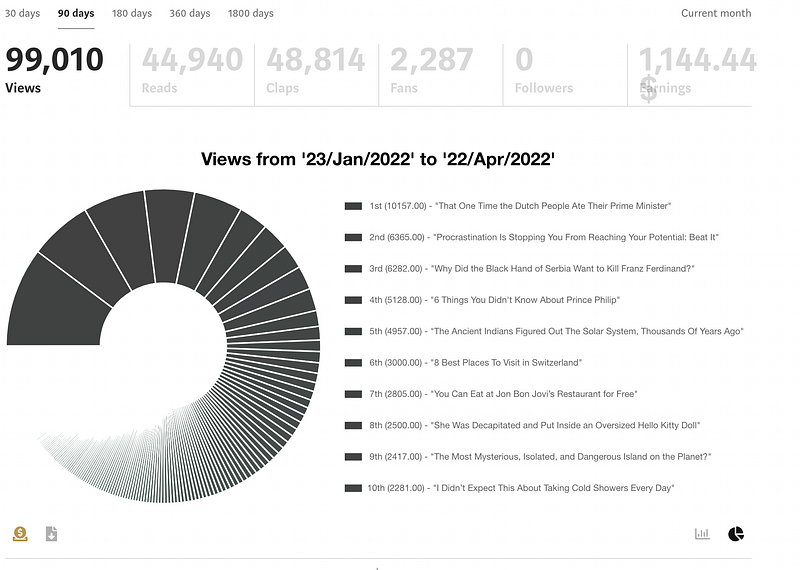
You can switch to a chart as well to view which stories performed the best over the period you have selected.
Use these plugins to your advantage.