
Use Statsmodels ARIMA to predict on India’s weather for 12 months of the year

Time series forecasting is the use of a model to predict future values based on previously observed values.
Statsmodels is a Python library that is used to analyse and make predictions on time series data.
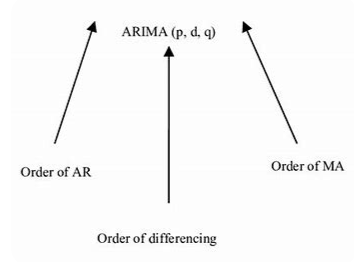
One statsmodels function that can be used to make predictions on time series data is the ARIMA model. The autoregressive integrated moving average (ARIMA) model is a generalisation of an autoregressive moving average (ARMA) model. The autoregressive (AR) part of ARIMA indicates that the evolving variable of interest is regressed on its own lagged (i.e., prior) values. The moving average (MA) part indicates that the regression error is actually a linear combination of error terms whose values occurred contemporaneously and at various times in the past. The I (for “integrated”) indicates that the data values have been replaced with the difference between their values and the previous values (and this differencing process may have been performed more than once). The purpose of each of these features is to make the model fit the data as well as possible.
Non-seasonal ARIMA models are generally denoted ARIMA(p,d,q) where parameters p, d, and q are non-negative integers, p is the order (number of time lags) of the autoregressive model, d is the degree of differencing (the number of times the data have had past values subtracted), and q is the order of the moving-average model.
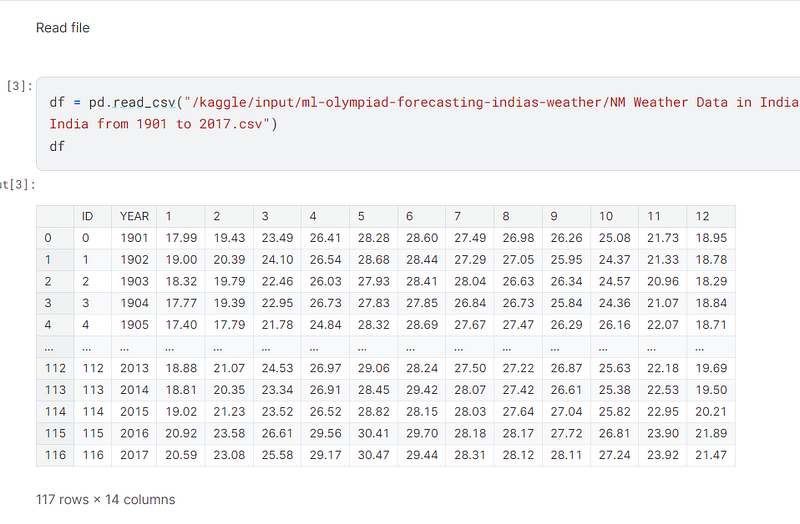
Kaggle, the data science company, that hosts numerous data science competitions does not offer a lot of time series forecasting problems, so it is always a pleasure to be able to work on one. The time series forecasting competition question that I have worked on in this blog post concerns monthly temperatures in India from 1901 to 2017, and can be found here:- https://www.kaggle.com/competitions/ml-olympiad-forecasting-indias-weather
I have written the Python program in Kaggle’s Jupyter Notebook and it is saved in my account for that company.
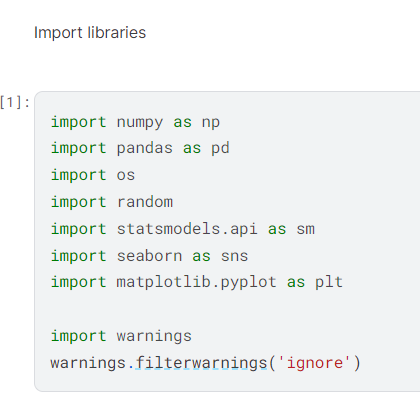
The first thing that I did was to import the libraries I would need to execute the program, being:-
- Numpy to create numpy arrays and carry out mathematical computations,
- Pandas to create dataframes and process data,
- Os to go into the operating system and retrieve files,
- Random to create random numbers,
- Statsmodels to provide time series analysis functionality,
- Seaborn to visualise data statistically,
- Matplotlib to further visualise the data, and
- Warnings to ignore them in the program.
I used pandas to read the csv file located in the operating system and convert it to a dataframe, df.
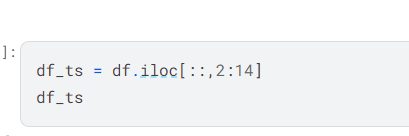
I sliced the dataframe to use only the columns of data that contained the monthly temperatures.
I used the random library to set the seed of the program.
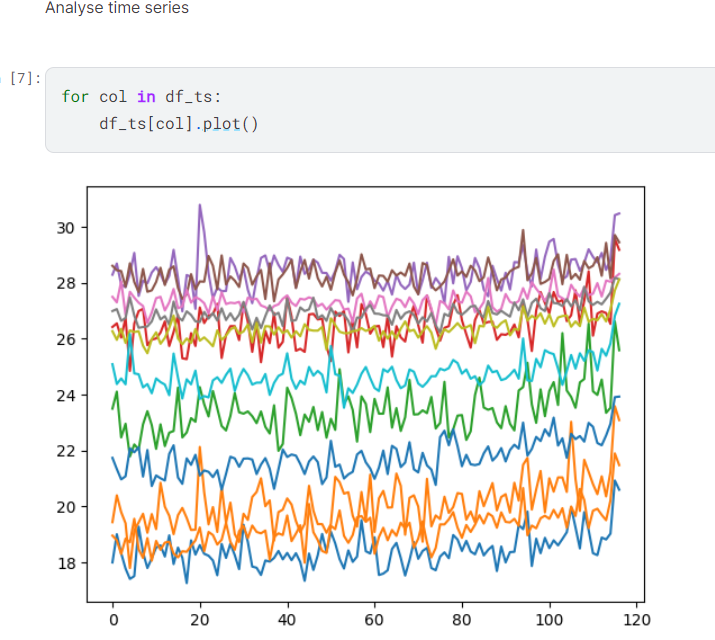
I plotted the twelve time series.
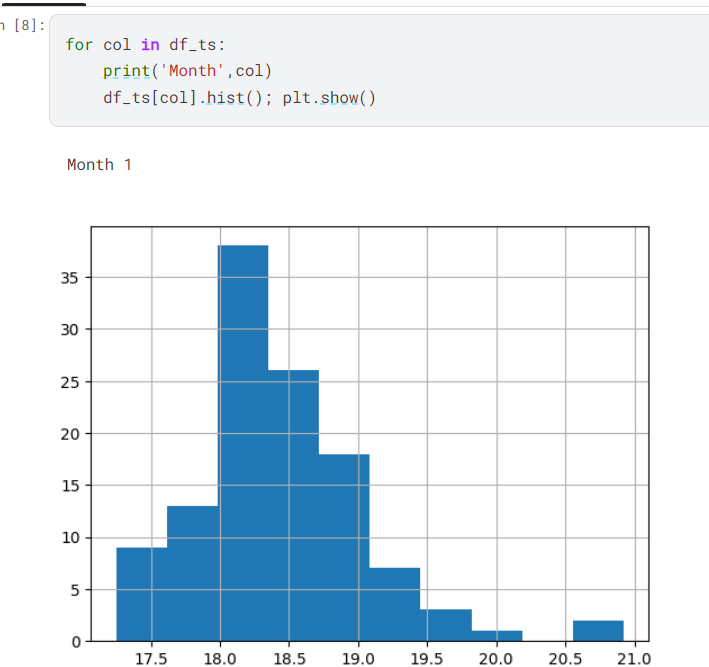
I plotted histograms of the twelve columns of temperature data.
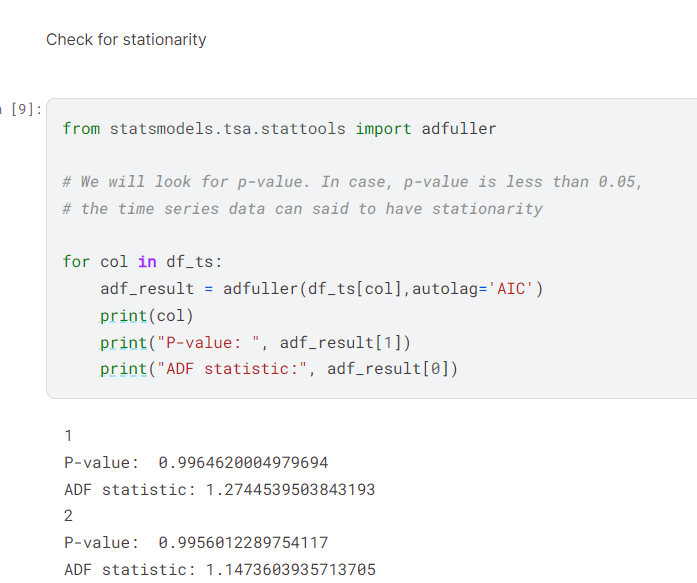
I used statsmodels adfuller function to check for stationarity. The twelve columns of data are not stationary, but the ARIMA model can be used with non-stationary data.
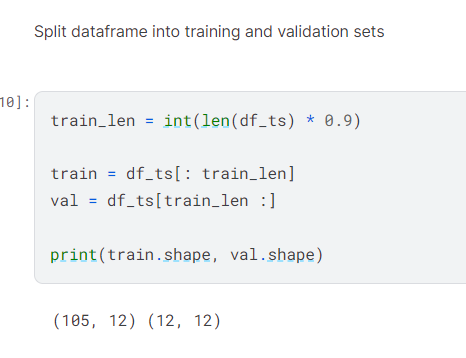
I split the dataframe into train and val frames.
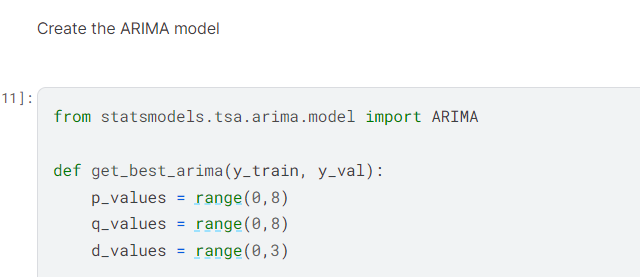
I created an ARIMA model using statsmodels arima function.
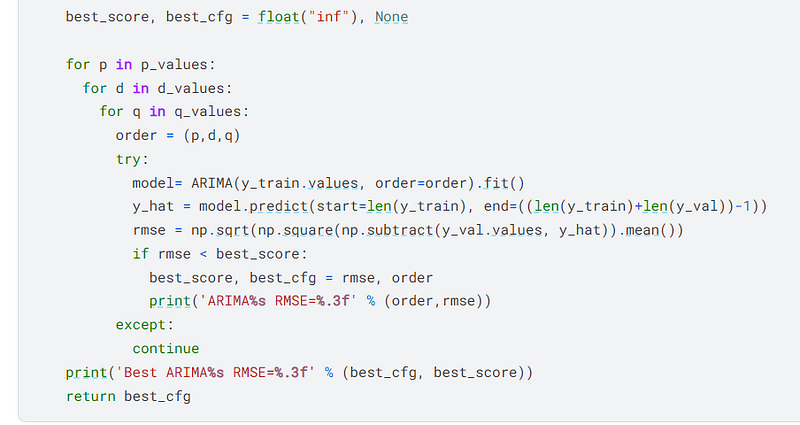
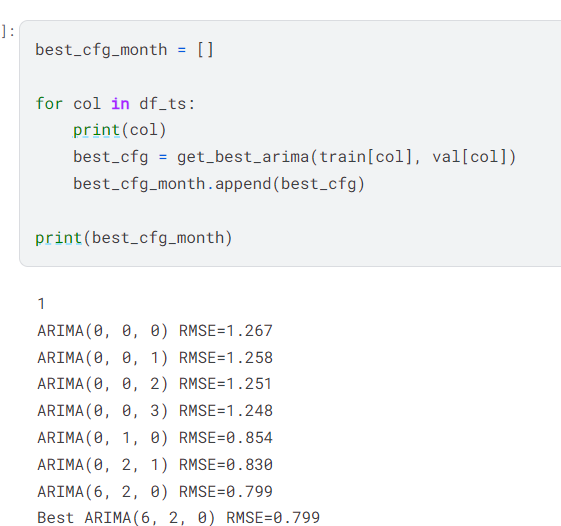
I used the ARIMA model to determine the best configuration for all twelve columns of data.
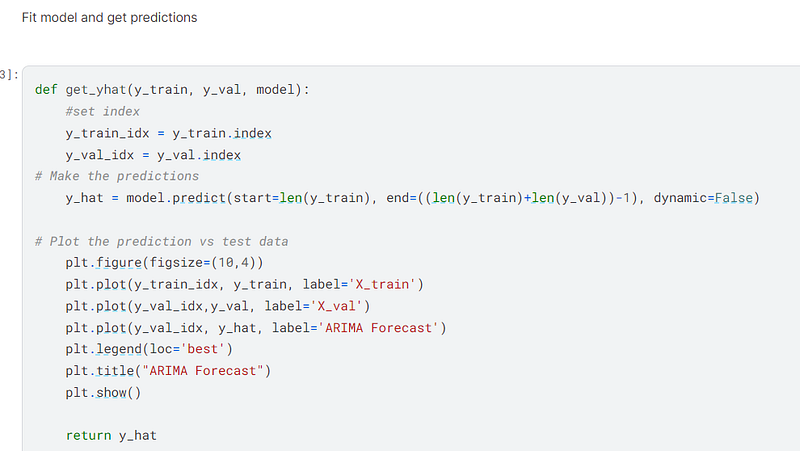
I fit and made predictions on the val dataframe on all twelve columns of data.
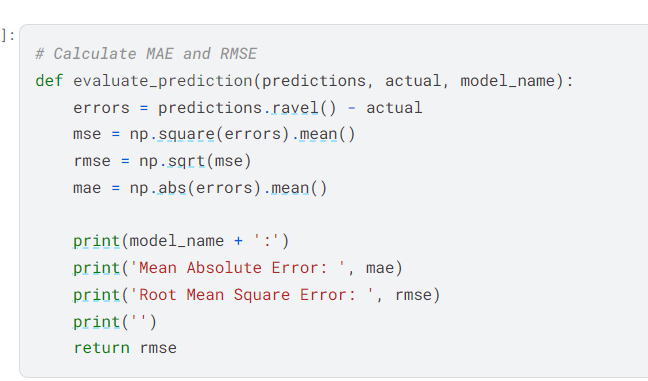
I defined the function to calculate the root mean squared error (rmse) and mean absolute error (mae) on all twelve columns od temperature data.
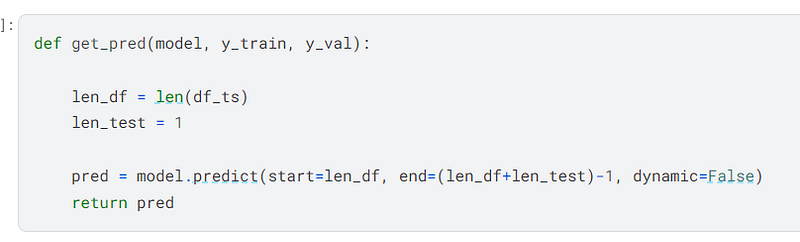
I defined the function to get the predictions.
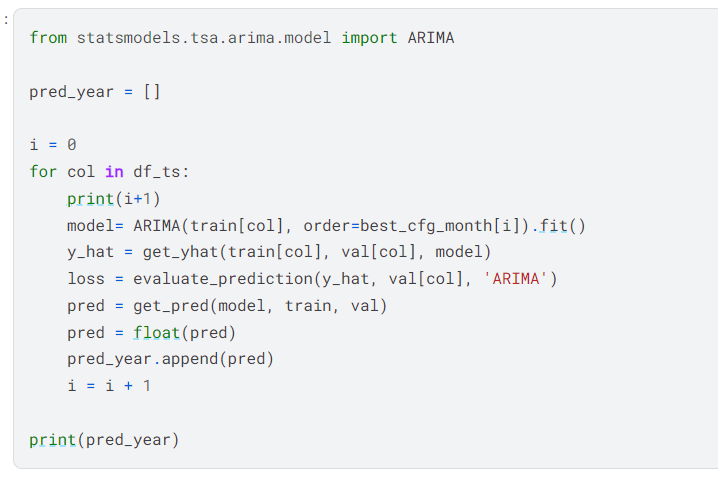
I used statsmodels’ ARIMA model to fit the data, make predictions on the val dataframe, calculate the loss, and obtain the predictions for the test set on all twelve columns of data.
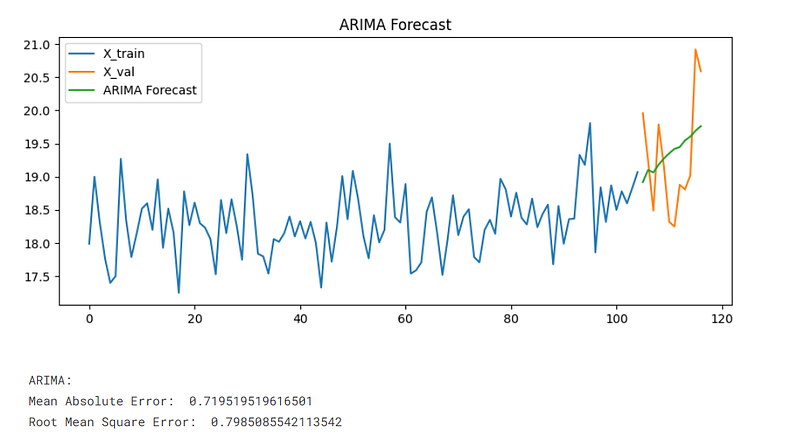
Below is a diagram of the ARIMA forecast for the month of January from 1901 to 2017. It can be seen from the plot and the values in the dataframe that the temperatures are slowing increasing through time.
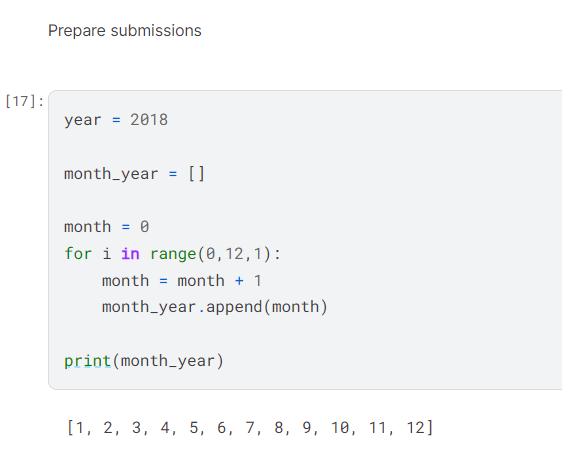
I then prepared the submissions by setting the year to 2018 and the months from 1 to 12.
I then prepared a dataframe, my_submission, which has the columns, ‘Month’, ‘Prediction(temp), and ‘Year’.
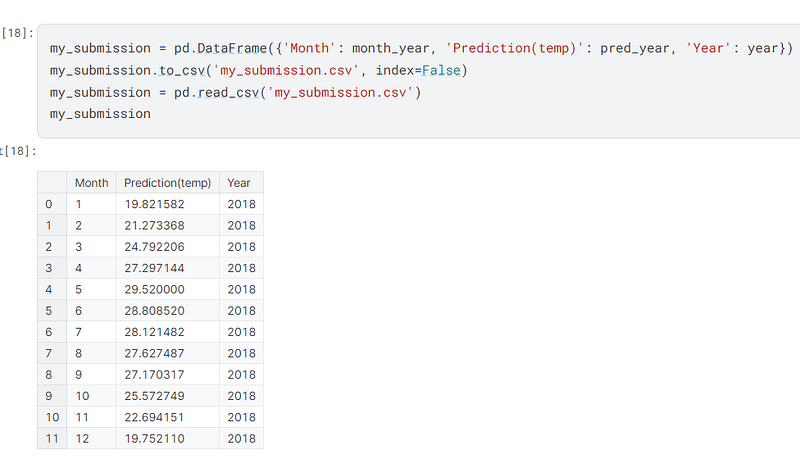
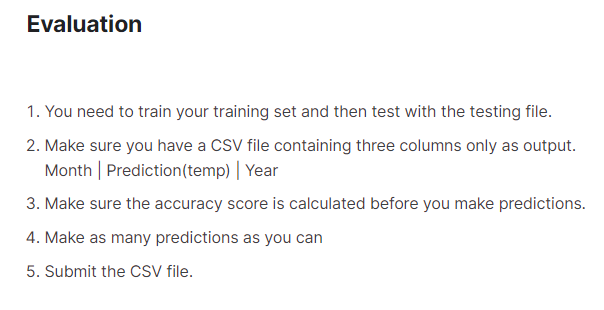
I prepared the submission in accordance with the instructions in the Overview of the competition, but my submission failed because I did not have an ‘ID’ column in the dataframe.
I sent a message to the host of the competition and they changed the instructions. I may or may not make another submission and see how well I fared. There is much to learn in the field of time series forecasting, so I may endeavour to employ some new techniques to see the effect they have on the predictions.
I have created a code review to accompany this blog post and it can be viewed here:- https://youtu.be/r2R2EsgmLhs