
Use itertools.groupby() to Count Consecutive Occurrences in Python
For example, how many days did the longest heat wave last?

Context is everything. Why is this useful?
As an analyst, you may want to explore nuances such as consecutiveness to understand root causes or to remove outliers in data.
The topic that inspired this article is weather. In 2022, the Portland, Oregon temperatures were mild compared to many record-setting heat waves in other parts of the world or even Portland in the previous year.
However, even though 2022 might be mild compared to the record heat in 2021, the year seemed hot. Perhaps consecutive days of hot weather had impacted my perception? Let’s count the hot day streaks (also known as heat waves) with Python to analyze this assumption.
Weather data for the US
In a previous article, I wrote about the publicly available data source that I’m about to use from the National Centers for Environmental Information (NCEI). Please read that article for more details about how to access the data and visit NCEI to learn more about NCEI and the National Environmental Satellite, Data, and Information Service’s (NESDIS) mission.
In this article, the focus will be on TMAX, the maximum observed daily temperature at particular weather stations. The data for Portland, Oregon and my exploratory data analysis are available on GitHub.
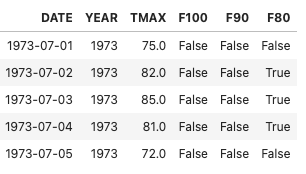
The following data frame was created for this analysis and contains True / False boolean fields that indicate whether the temperature was at least 80 degrees, at least 90 degrees, or at least 100 degrees Fahrenheit.
Consecutive days in a row with temperature above 90 degrees Fahrenheit
To calculate consecutive occurrences is not as simple as you might think. There are multiple calculations required to arrive at a solution, and developing an algorithm that can work on years of data is not trivial.
However, there are packages that reduce the number of functions to write for this algorithm. The itertools.groupby() package for Python was the easiest method for me to implement for this analysis.
First, import the groupby() function from the itertools package.
from itertools import groupbyNext, define a function that takes a list of data points for a year as the parameter and then returns a list.
Each element in this returned list contains the length of each heat wave that year. For example, if the threshold that we set for heat is 90 degrees Fahrenheit, then a list with four elements such as [1, 5, 1, 2] for a given year would mean that there were four heat waves in that year. The first wave contained 1 day with a maximum temperature at or above 90 degrees. The second wave contained 5 days in a row above 90 degrees. And so on.
- The first wave contained 1 day with a maximum temperature at or above 90 degrees. The second wave contained 5 days in a row above 90 degrees. And so on.
Then, write another function to do the following:
- Determine the longest heat wave for each year using the function defined above
- Loop through each year in a data frame
- Return a data frame of the longest 90 degree heat wave (in days) for each year
A similar function is written for 80 degrees and 100 degrees, in order to obtain comparisons.
Analysis of Results
Before reviewing the longest heat waves in each year, let’s inspect the number of overall heat days by year.
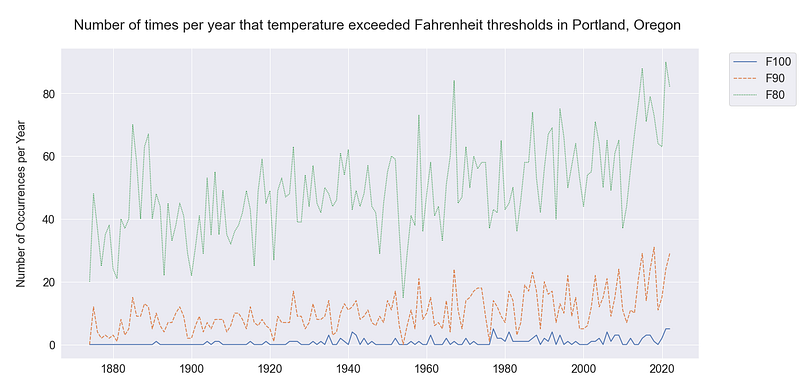
Indeed 2021 was hot! There were 90 days at or above 80 degrees, the most in recorded history. The number of 100 degree days and 90 degree days also describe the year as one of the hottest on record.
After the original version of this article was written at the end of the summer, Portland actually had a record-breaking twelve 80 degree days in October. Otherwise, there would have been about twenty more 80 degree days in 2021.

The next chart shows the longest heat waves through 2022.
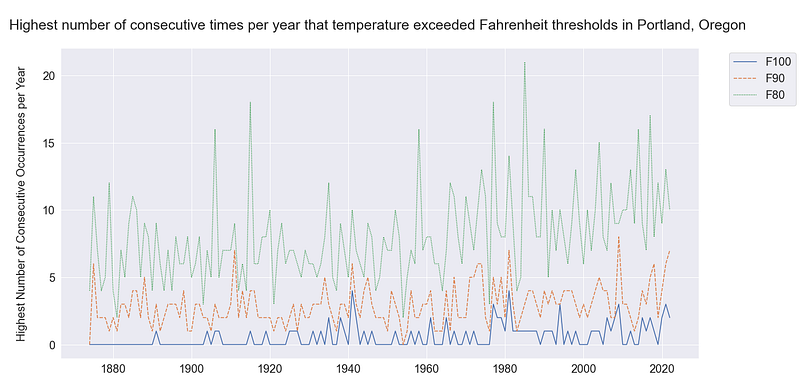
For 80 degree+
- The longest heat wave on record (21 days) happened in 1985.
- 2022 ranked 27th with 10 days
- 2021 ranked 11th with 13 days
For 90 degree+
- The longest heat wave on record (8 days) happened in 2009
- 2022 ranked 2nd with 7 days
- 2021 ranked 5th with 6 days
For 100 degree+
- The longest heat waves on record (4 days) happened in 1941 and 1981
- 2022 ranked 7th with 2 days
- 2021 ranked 4th with 3 days
Conclusion: My hypothesis was wrong
Although this analysis didn’t include experimental design for statistical significance, the summary of the two years’ heat waves already indicates that recent memory was biasing my opinion about the hot summer of 2022.

I found a few trends interesting:
- There were more cool-down periods in 2021 compared to the other hottest years. This is why the total number of heat days did not result in the longest heat wave on record.
- The consecutive heat-day streaks seem to be cyclical. The last year (2022) is on the lower end of the cycle.
- There is a trend of an increasing number of days of hot weather each year, but the trend is less clear with heat waves.
Last Updated 2022-December: Added article image, updated charts with September and October data, and some minor editing for readability.
If you enjoyed this article and would like to read (and write) more articles like this, please consider clicking the Follow button by my profile picture and/or subscribing to a medium membership using my referral link: https://sabolch-horvat.medium.com/membership


