avatarVaclav Dekanovsky

Free AI web copilot to create summaries, insights and extended knowledge, download it at here

6529

Abstract

-analysis-eda-of-secs-quarterly-data-summary-455e62ff4817">companies’ fundamental data in order to predict future stock prices</a>, some companies report them quarterly, while others twice a year. Some do so in November, while others in August. If you would wait until everyone provides their data, you might come up with a precise prediction, but at that time all the lucrative stock would be sold out.</p><figure id="3886"><img src="https://cdn-images-1.readmedium.com/v2/resize:fit:800/1*VSkoXXHY_muJAnQoHpethw.png"><figcaption>Image by Author (<a href="https://about.canva.com/license-agreements/onedesign/">license</a>)</figcaption></figure><blockquote id="b517"><p>Usually 80% of the inputs hold the same pattern and 20% including some imporant scenarios have unusual structure you have to recalculate.</p></blockquote><p id="dcf4">To work around these data leaks, you can upsample to average.</p><h2 id="1d6c">Upsample with an average</h2><p id="8863">I’m talking about the option to smooth the inconsistently reported data, so that you can</p><div id="4afe"><pre>[IN]: data=<span class="hljs-string">""" CAT|DATE|VALUE abc|0101|10 abc|0103|20 abc|0105|15 efg|0102|40 efg|0105|30"""</span></pre></div><div id="9138"><pre>[OUT]: CAT|<span class="hljs-type">DATE</span>|<span class="hljs-type">VALUE</span> abc|<span class="hljs-type">0102</span>|<span class="hljs-type">10</span> abc|<span class="hljs-type">0103</span>|<span class="hljs-type">10</span> # <span class="hljs-number">20</span> on <span class="hljs-number">0103</span> covers interval <span class="hljs-number">0102</span><span class="hljs-number">-0103</span> (<span class="hljs-number">2</span> days) abc|<span class="hljs-type">0104</span>|<span class="hljs-type">7</span><span class="hljs-number">.5</span> abc|<span class="hljs-type">0105</span>|<span class="hljs-type">7</span><span class="hljs-number">.5</span> # <span class="hljs-number">15</span> on <span class="hljs-number">0105</span> covers interval <span class="hljs-number">0104</span><span class="hljs-number">-0105</span> (<span class="hljs-number">2</span> days) efg|<span class="hljs-type">0103</span>|<span class="hljs-type">10</span> efg|<span class="hljs-type">0104</span>|<span class="hljs-type">10</span> efg|<span class="hljs-type">0105</span>|<span class="hljs-type">10</span> # <span class="hljs-number">30</span> on <span class="hljs-number">0105</span> covers interval <span class="hljs-number">0103</span><span class="hljs-number">-0105</span> (<span class="hljs-number">3</span> days)</pre></div><p id="733f">The example above is quite simple, but imagine you have thousands of categories. Some reported daily, others bi-daily in odd or even days, the rest every three days or irregularly.</p><h2 id="ebb4">How to do the average magic</h2><p id="4582">In order to calculate the average, you need two things — the <code>sum</code> divided by the <code>count</code>. You know the sum, because it was reported, but the number of days (months, weeks …) since the last value is unknown. Luckily, pandas resampling contains a parameter <code>.group</code> which exposes, how many groups were created when upsampled.</p><p id="cd5a">Unfortunately, it doesn’t work natively with <code>groupby</code> so we’ll look on a single category first.</p><div id="7afc"><pre><span class="hljs-attr">data</span>=<span class="hljs-string">""" CAT|DATE|VALUE abc|0101|10 abc|0103|20 abc|0106|15"""</span></pre></div><p id="dafe">The <a href="https://pandas.pydata.org/pandas-docs/stable/reference/resampling.html">resample</a> method has two attributes:</p><ul><li><code>indices</code> — showing where the input data appeared</li><li><code>groups</code> — indexing each DateTime value with its group index.</li></ul><div id="61ff"><pre><span class="hljs-comment"># indices</span> [<span class="hljs-keyword">In</span>]: df.set_index(<span class="hljs-string">"DATE"</span>).resample(<span class="hljs-string">"D"</span>).indices [Out]: defaultdict(list, {Timestamp(<span class="hljs-string">'1900-01-01 00:00:00'</span>, <span class="hljs-attribute">freq</span>=<span class="hljs-string">'D'</span>): [0], Timestamp(<span class="hljs-string">'1900-01-03 00:00:00'</span>, <span class="hljs-attribute">freq</span>=<span class="hljs-string">'D'</span>): [1], Timestamp(<span class="hljs-string">'1900-01-06 00:00:00'</span>, <span class="hljs-attribute">freq</span>=<span class="hljs-string">'D'</span>): [2]})</pre></div><div id="4ea2"><pre><span class="hljs-comment"># groups</span> [<span class="hljs-keyword">In</span>]: df.set_index(<span class="hljs-string">"DATE"</span>).resample(<span class="hljs-string">"D"</span>).groups [Out]: {Timestamp(<span class="hljs-string">'1900-01-01 00:00:00'</span>, <span class="hljs-attribute">freq</span>=<span class="hljs-string">'D'</span>): 1, Timestamp(<span class="hljs-string">'1900-01-02 00:00:00'</span>, <span class="hljs-attribute">freq</span>=<span class="hljs-string">'D'</span>): 1, Timestamp(<span class="hljs-string">'1900-01-03 00:00:00'</span>, <span class="hljs-attribute">freq</span>=<span class="hljs-string">'D'</span>): 2, Timestamp(<span class="hljs-string">'1900-01-04 00:00:00'</span>, <span class="hljs-attribute">freq</span>=<span class="hljs-string">'D'</span>): 2, Timestamp(<span class="hljs-string">'1900-01-05 00:00:00'</span>, <span class="hljs-attribute">freq</span>=<span class="hljs-string">'D'</span>): 2, Timestamp(<span class="hljs-string">'1900-01-06 00:00:00'</span>, <span class="hljs-attribute">freq</span>=<span class="hljs-string">'D'</span>): 3}</pre></div><p id="a4c1">January first and second forms the first group, third to fifth are the second and the last data sample falls into the last group. Mostly the data are reported that the value on the reporting date is included — 20 reported on Jan-3 covers Jan-2 and Jan-3. In that case, you use <code>label</code> parameter and set it to <code>right</code>.</p><div id="6ff4"><pre><span class="hljs-meta"># groups</span> [In]: df.set_index(<span class="hljs-string">"DATE"</span>).resample(<span class="hljs-string">"D"</span>, label=<span class="hljs-string">"right).groups</span> [Out]: { Timestamp('<span class="hljs-number">1900-01-02</span> 00:00:00', freq='D'): <span class="hljs-number">1</span>, Timestamp('<span class="hljs-number">1900-01-03</span> 00:00:00', freq='D'): <span class="hljs-number">1</span>, Timestamp('<span class="hljs-number">1900-01-04</span> 00:00:00', freq='D'): <span class="h

Options

ljs-number">2</span>, Timestamp('<span class="hljs-number">1900-01-05</span> 00:00:00', freq='D'): <span class="hljs-number">2</span>, Timestamp('<span class="hljs-number">1900-01-06</span> 00:00:00', freq='D'): <span class="hljs-number">2</span>, Timestamp('<span class="hljs-number">1900-01-07</span> 00:00:00', freq='D'): <span class="hljs-number">3</span>,}</pre></div><p id="81e1">Alternatively you can turn the groups into a dataframe and shift the values</p><div id="de05"><pre>df_groups = pd<span class="hljs-selector-class">.DataFrame</span>(df<span class="hljs-selector-class">.set_index</span>(<span class="hljs-string">"DATE"</span>)<span class="hljs-selector-class">.resample</span>(<span class="hljs-string">"D"</span>)<span class="hljs-selector-class">.groups</span>, index=<span class="hljs-selector-attr">[<span class="hljs-string">"group"</span>]</span>)<span class="hljs-selector-class">.T</span><span class="hljs-selector-class">.shift</span>(<span class="hljs-number">1</span>)</pre></div><p id="f54a">Then you count the occurrences in each group.</p><div id="d491"><pre><span class="hljs-attr">s</span> = df_groups.groupby(<span class="hljs-string">"group"</span>).size() <span class="hljs-attr">s.name</span> = <span class="hljs-string">"count"</span></pre></div><p id="595b">And join the counts with the dates and backfilled values. It results into a dataframe having a sum for the period and number of occurrences in this period which is all you need to calculate the average.</p> <figure id="8c2a"> <div> <div>

            <iframe class="gist-iframe" src="/gist/vaclavdekanovsky/4458418101fdeca5df08db468fe887a8.js" allowfullscreen="" frameborder="0" height="undefined" width="undefined">
          </div>
        </div>
    </figure></iframe></div></div></figure><p id="baa3">If you shout with excitement now, hold on, we’re not at the finish line yet. We have calculated the average for a single group, but in case we want to <code>groupby</code> multiple categories, e.g. when we have many stores, companies, or sensors to work with, we must calculate the average for each group separately.</p><p id="978e">It’s not complicated, but it can be time-consuming in case you have many inputs. See the code below:</p>
    <figure id="3d94">
        <div>
          <div>
            
            <iframe class="gist-iframe" src="/gist/vaclavdekanovsky/5bd2fd13fd6928a9d8c2aa31dbaf4651.js" allowfullscreen="" frameborder="0" height="undefined" width="undefined">
          </div>
        </div>
    </figure></iframe></div></div></figure><p id="94ae">You have smoothed the data to average, but often you don’t need each monthly average. You only needed to cover different reporting periods. For example in financial analysis reviewing the <a href="https://towardsdatascience.com/stock-fundamental-analysis-eda-of-secs-quarterly-data-summary-455e62ff4817">performance of publicly traded companies</a>, most of them report the data at the end of the quarter. But some do it in different months, or even not quarterly. If you want to model the behavior of a whole bunch of companies, you first smooth to average those which doesn’t report quarterly and the use <code>rolling</code> function limit the inputs to quarters only.</p><blockquote id="12ee"><p>More inputs mean more model parameters and longer computing time</p></blockquote><p id="ec2d">Let’s look on the stock market analysis example:</p>
    <figure id="0040">
        <div>
          <div>
            
            <iframe class="gist-iframe" src="/gist/vaclavdekanovsky/7714cb8b36f341947bd716adf0488019.js" allowfullscreen="" frameborder="0" height="undefined" width="undefined">
          </div>
        </div>
    </figure></iframe></div></div></figure><p id="49a0">Once again the coding gets us surprised. When you apply <code>.resample("D", label="right")</code> resampling to <b>days </b>the results are the same as <code>.resample("D", label="right", <b>closed="left"</b>)</code>. If you do the same while resampling to <b>months</b>, the <code>label="right"</code> matches <code>label="right", <b>closed="right"</b></code>. For this reason, you must specify <code>label="right", closed="left"</code> for the monthly calculation or use the workaround with <code>shift</code> mentioned above.</p>
    <figure id="503d">
        <div>
          <div>
            
            <iframe class="gist-iframe" src="/gist/vaclavdekanovsky/54db0f00be236590df0d6d764143a6d7.js" allowfullscreen="" frameborder="0" height="undefined" width="undefined">
          </div>
        </div>
    </figure></iframe></div></div></figure><h1 id="dae3">Conclusion</h1><p id="9fa0">I hope that you have learned something not only about resampling but how to use alternative approaches to align inconsistent data when feeding your machine learning models.</p><div id="0395"><pre>The images were <span class="hljs-keyword">with</span> canva.com (affiliate link, when you click <span class="hljs-keyword">on</span> <span class="hljs-keyword">it</span> <span class="hljs-keyword">and</span> purchase a product, you won't pay more, <span class="hljs-keyword">but</span> I can receive a small reward; you can always <span class="hljs-built_in">write</span> canva.com <span class="hljs-keyword">to</span> your browser <span class="hljs-keyword">to</span> avoid this). Canva offer <span class="hljs-keyword">some</span> free templates <span class="hljs-keyword">and</span> graphics too. 

Other articles:

  • Everything you wanted <span class="hljs-keyword">to</span> know <span class="hljs-keyword">about</span> Kfold train-test split
  • Why <span class="hljs-keyword">it</span>'s worth <span class="hljs-keyword">considering</span> another <span class="hljs-built_in">file</span> types than csv
  • How <span class="hljs-keyword">to</span> turn a <span class="hljs-built_in">list</span> <span class="hljs-keyword">of</span> addreses <span class="hljs-keyword">into</span> a map</pre></div><div id="1397"><pre><span class="hljs-type">Great</span> thanks to <span class="hljs-type">Towards</span> <span class="hljs-class"><span class="hljs-keyword">data</span> science</span></pre></div><p id="20f8">Full Code available on Github —<a href="https://github.com/vaclavdekanovsky/data-analysis-in-examples/blob/master/Pandas/Upsample/Upsample%20to%20average.ipynb">Upsample_to_average.ipynb</a> .</p></article></body>

Getting Started

Upsample with an average in Pandas

Align inconsistently reported data for your machine learning

Image by Author (license)

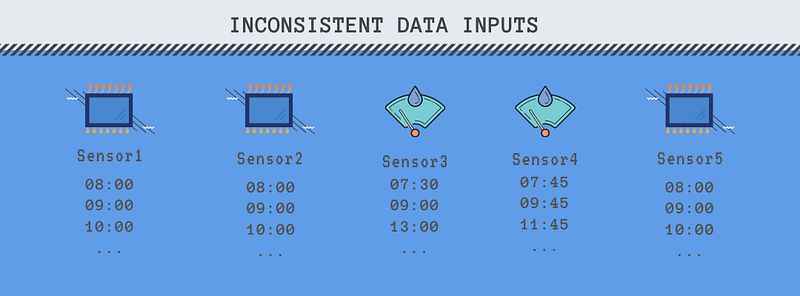
Many models input cumulative variables like rainfalls in a few hours or company revenue over some months. Unfortunately, the data sources are often not aligned in time. One sensor feeds the data every odd hour, another one in even hours. One company provides information in May and the other in June.

If you don’t want to wait for all your data sources to collect the inputs or when it doesn’t suit to feed the model with data coming from different time frames, you have to spread your measurement to the same periods of time. Pandas can natively do part of the job, but in this article, we’ll explore how to upsample with an average, which requires a little bit of extra coding.

You can run all the example from this tutorial through the notebook shared on Github — Upsample_to_average.ipynb

Resampling

Downsample

Resampling in python’s Pandas allows you to turn more frequent values to less frequent — downsample, e.g. hourly data to daily sum, count and average, or daily to monthly values.

# downsample:
CAT|DATE|VALUE
abc|0101|10
abc|0102|20
abc|0103|15
# downsample
[IN]: df.groupby("CAT").resample("W", on="DATE").agg({"VALUE":["sum","count","mean","first","last"]})
[OUT]:
CAT|DATE|SUM|COUNT|MEAN|MIN|MAX|FIRST|LAST
abc|0107|45 |   3 | 15 | 10| 20|  10 | 15

It’s called downsample because the number of data-rows decreases. You can apply sum, count, mean (for average), median, min, max, first or last. Based on daily inputs you can resample to weeks, months, quarters, years, but also to semi-months — see the complete list of resample options in pandas documentation. You can also resample to multiplies, e.g. 5H for groups of 5 hours.

Upsample

Resampling to more frequent timestamps is called upsampling. You can turn days into hours or months into days. When upsampling you must first set the DateTime column as an index of your data frame (.set_index), and only then you can upsample.

# error in case you try upsample using .resample("D", on="col")
ValueError: Upsampling from level= or on= selection is not supported, use .set_index(...) to explicitly set index to datetime-like

Besides the functions above, the upsampling supports backfill/bfill, ffill/pad and nearest. Though if you think that applying mean would split the daily value to an average per hour, you would be wrong. All the added up-samples are filled with NaN.

Why do we want to upsample into average

Let’s say you have a portfolio of shops and try to estimate the sales. You input the revenue on Jan-1, Jan-2 and Jan-3 and perform a regression to guess the target value on Jan-4. You train on all your shops and use the model to predict future sales.

But what if for some shops provide data only for Jan-2 and Jan-3. And others only onJan-1 and Jan-3. You can downsample and model using sum or average of these 3 days, but in such a case you lose valuable input information like Friday peeks or low Monday takings.

Contrary to common belief, this scenario is typical. When analyzing companies’ fundamental data in order to predict future stock prices, some companies report them quarterly, while others twice a year. Some do so in November, while others in August. If you would wait until everyone provides their data, you might come up with a precise prediction, but at that time all the lucrative stock would be sold out.

Image by Author (license)

Usually 80% of the inputs hold the same pattern and 20% including some imporant scenarios have unusual structure you have to recalculate.

To work around these data leaks, you can upsample to average.

Upsample with an average

I’m talking about the option to smooth the inconsistently reported data, so that you can

[IN]:
data="""
CAT|DATE|VALUE
abc|0101|10
abc|0103|20
abc|0105|15
efg|0102|40
efg|0105|30"""
[OUT]:
CAT|DATE|VALUE
abc|0102|10
abc|0103|10   # 20 on 0103 covers interval 0102-0103 (2 days)
abc|0104|7.5
abc|0105|7.5  # 15 on 0105 covers interval 0104-0105 (2 days)
efg|0103|10
efg|0104|10
efg|0105|10   # 30 on 0105 covers interval 0103-0105 (3 days)

The example above is quite simple, but imagine you have thousands of categories. Some reported daily, others bi-daily in odd or even days, the rest every three days or irregularly.

How to do the average magic

In order to calculate the average, you need two things — the sum divided by the count. You know the sum, because it was reported, but the number of days (months, weeks …) since the last value is unknown. Luckily, pandas resampling contains a parameter .group which exposes, how many groups were created when upsampled.

Unfortunately, it doesn’t work natively with groupby so we’ll look on a single category first.

data="""
CAT|DATE|VALUE
abc|0101|10
abc|0103|20
abc|0106|15"""

The resample method has two attributes:

  • indices — showing where the input data appeared
  • groups — indexing each DateTime value with its group index.
# indices
[In]: df.set_index("DATE").resample("D").indices
[Out]: 
defaultdict(list,
            {Timestamp('1900-01-01 00:00:00', freq='D'): [0],
             Timestamp('1900-01-03 00:00:00', freq='D'): [1],
             Timestamp('1900-01-06 00:00:00', freq='D'): [2]})
# groups
[In]: df.set_index("DATE").resample("D").groups
[Out]:
{Timestamp('1900-01-01 00:00:00', freq='D'): 1,
 Timestamp('1900-01-02 00:00:00', freq='D'): 1,
 Timestamp('1900-01-03 00:00:00', freq='D'): 2,
 Timestamp('1900-01-04 00:00:00', freq='D'): 2,
 Timestamp('1900-01-05 00:00:00', freq='D'): 2,
 Timestamp('1900-01-06 00:00:00', freq='D'): 3}

January first and second forms the first group, third to fifth are the second and the last data sample falls into the last group. Mostly the data are reported that the value on the reporting date is included — 20 reported on Jan-3 covers Jan-2 and Jan-3. In that case, you use label parameter and set it to right.

# groups
[In]: df.set_index("DATE").resample("D", label="right).groups
[Out]:
{
 Timestamp('1900-01-02 00:00:00', freq='D'): 1,
 Timestamp('1900-01-03 00:00:00', freq='D'): 1,
 Timestamp('1900-01-04 00:00:00', freq='D'): 2,
 Timestamp('1900-01-05 00:00:00', freq='D'): 2,
 Timestamp('1900-01-06 00:00:00', freq='D'): 2,
 Timestamp('1900-01-07 00:00:00', freq='D'): 3,}

Alternatively you can turn the groups into a dataframe and shift the values

df_groups = pd.DataFrame(df.set_index("DATE").resample("D").groups, index=["group"]).T.shift(1)

Then you count the occurrences in each group.

s = df_groups.groupby("group").size()
s.name = "count"

And join the counts with the dates and backfilled values. It results into a dataframe having a sum for the period and number of occurrences in this period which is all you need to calculate the average.

If you shout with excitement now, hold on, we’re not at the finish line yet. We have calculated the average for a single group, but in case we want to groupby multiple categories, e.g. when we have many stores, companies, or sensors to work with, we must calculate the average for each group separately.

It’s not complicated, but it can be time-consuming in case you have many inputs. See the code below:

You have smoothed the data to average, but often you don’t need each monthly average. You only needed to cover different reporting periods. For example in financial analysis reviewing the performance of publicly traded companies, most of them report the data at the end of the quarter. But some do it in different months, or even not quarterly. If you want to model the behavior of a whole bunch of companies, you first smooth to average those which doesn’t report quarterly and the use rolling function limit the inputs to quarters only.

More inputs mean more model parameters and longer computing time

Let’s look on the stock market analysis example:

Once again the coding gets us surprised. When you apply .resample("D", label="right") resampling to days the results are the same as .resample("D", label="right", closed="left"). If you do the same while resampling to months, the label="right" matches label="right", closed="right". For this reason, you must specify label="right", closed="left" for the monthly calculation or use the workaround with shift mentioned above.

Conclusion

I hope that you have learned something not only about resampling but how to use alternative approaches to align inconsistent data when feeding your machine learning models.

The images were with canva.com (affiliate link, when you click on it and purchase a product, you won't pay more, but I can receive a small reward; you can always write canva.com to your browser to avoid this). Canva offer some free templates and graphics too. 
Other articles:
* Everything you wanted to know about Kfold train-test split
* Why it's worth considering another file types than csv
* How to turn a list of addreses into a map
Great thanks to Towards data science

Full Code available on Github —Upsample_to_average.ipynb .

Python
Pandas
Machine Learning
Data Preprocessing
Getting Started
Recommended from ReadMedium