

Updates from 2022 and plans for 2023
Dear readers,
First of all, apologies for the hiatus from Medium! I didn’t write much in 2022, but your activity and engagements kept this Stata corner going. Plus this doesn’t mean that no work on data visualizations happened. On the contrary, three major developments took place:
1) I released 16 data visualization packages! Here is a preview of the packages in alphabetical order:
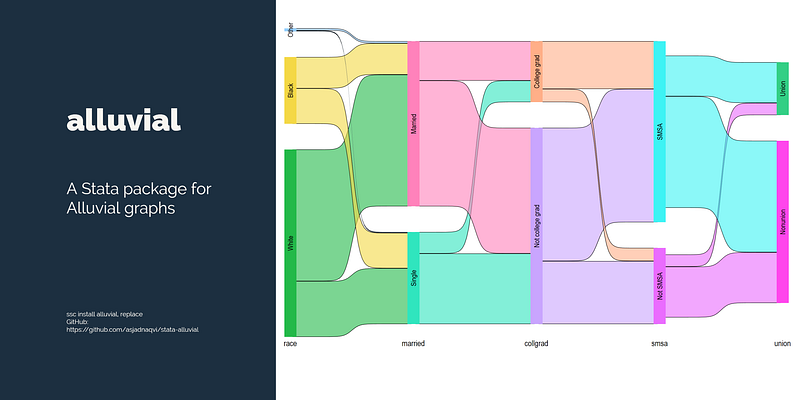
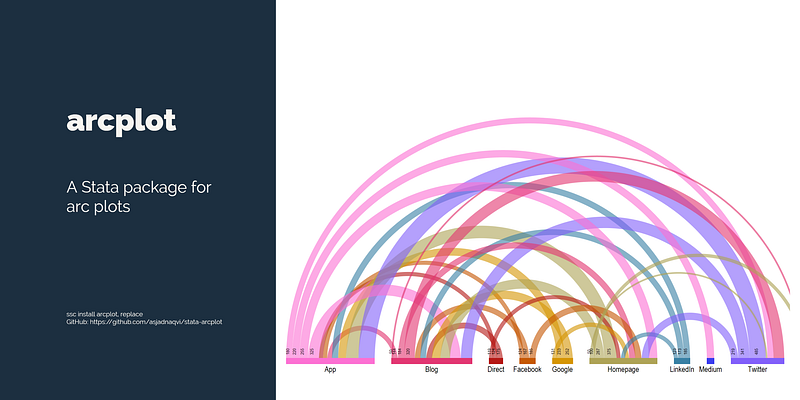
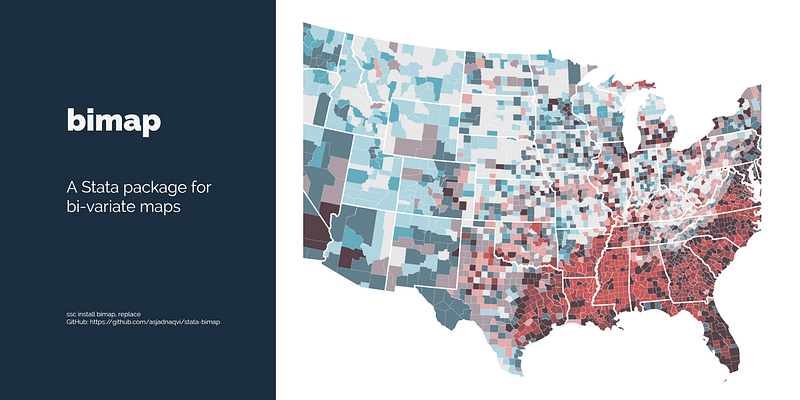
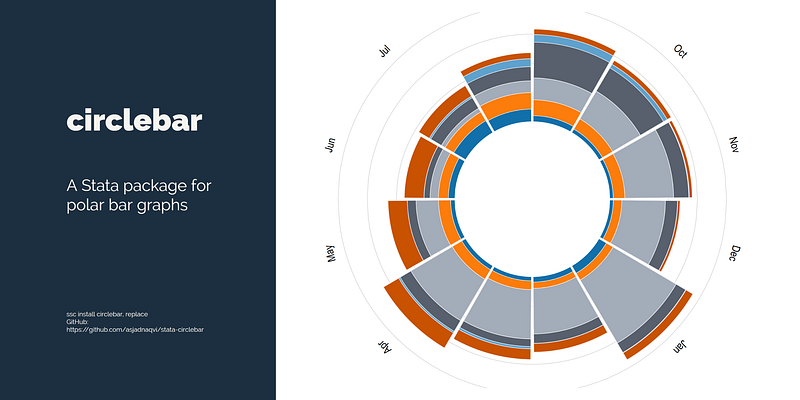
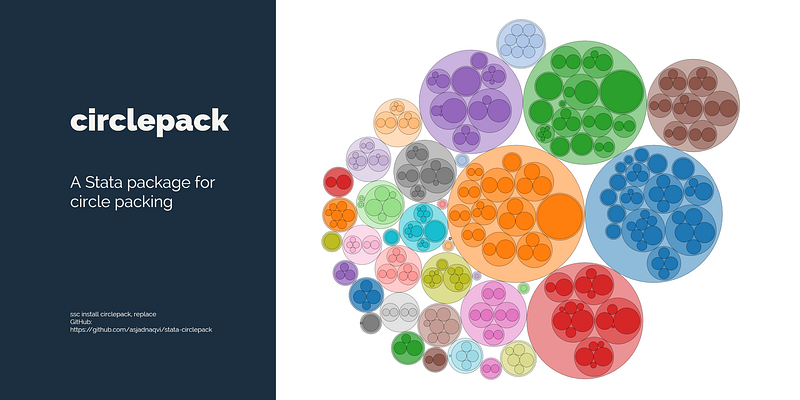
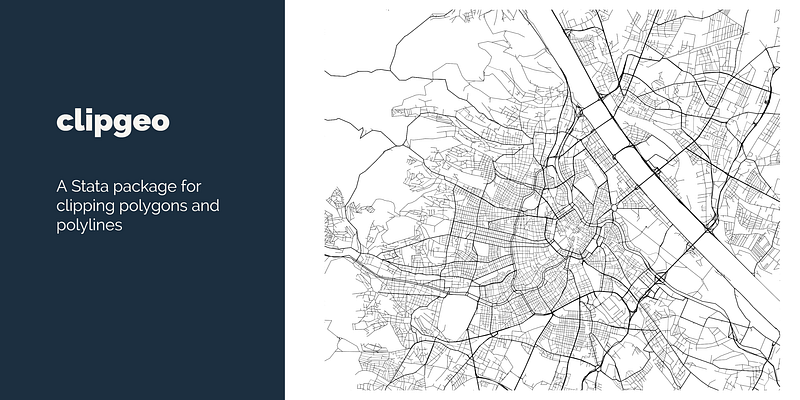
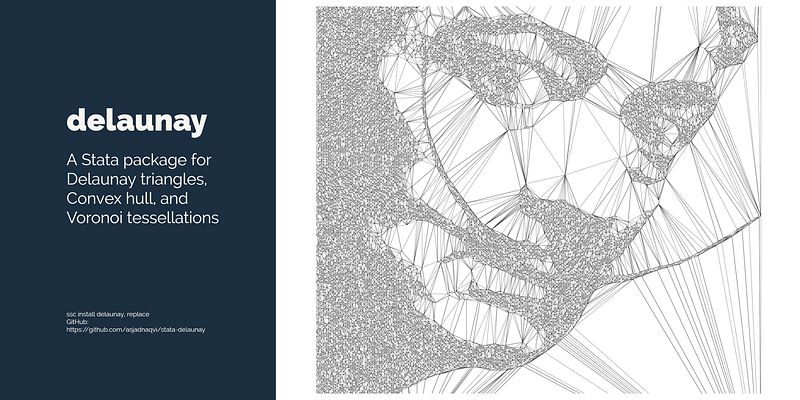
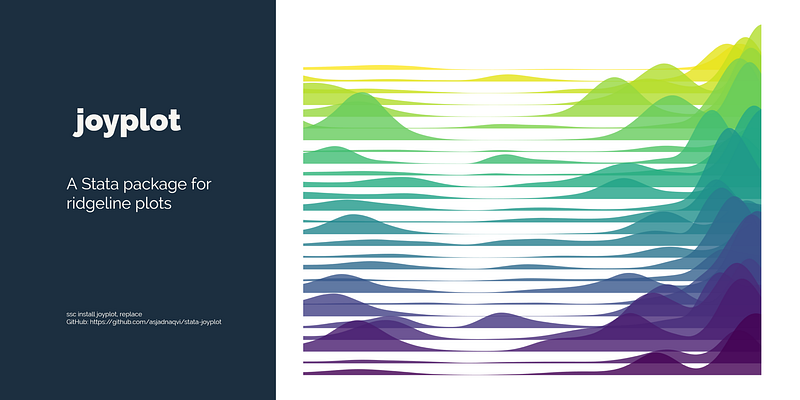
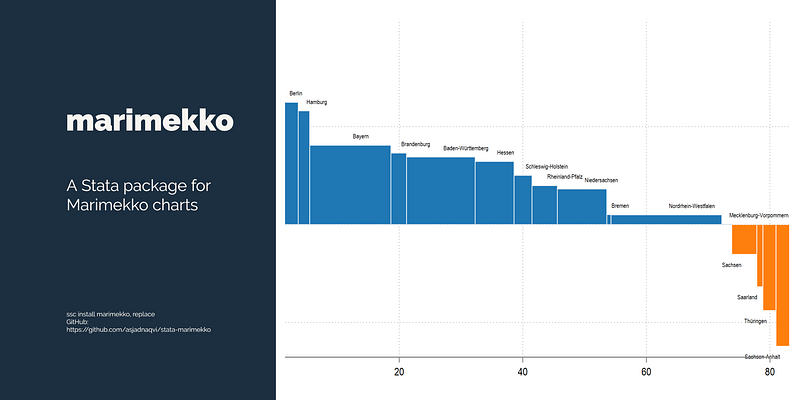
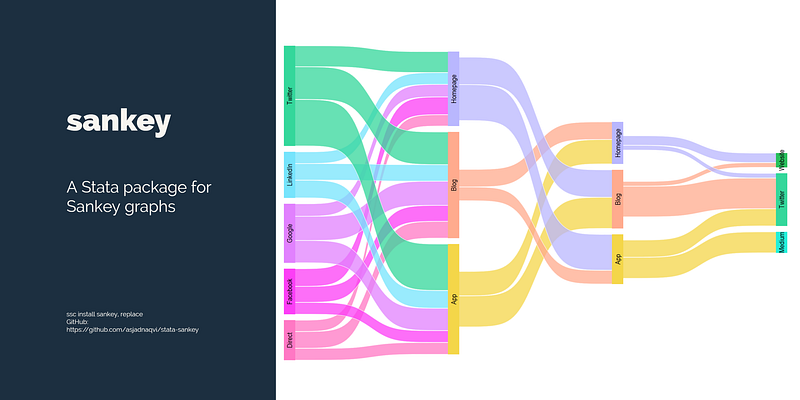
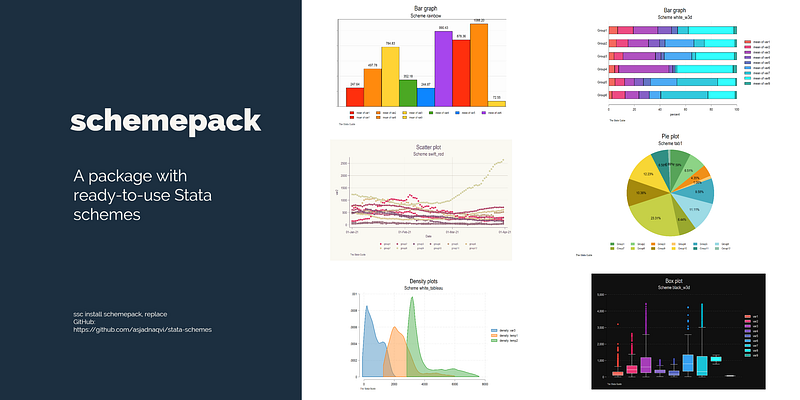
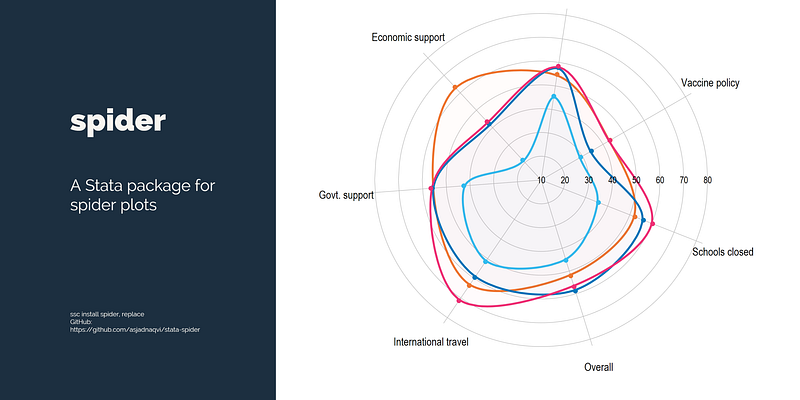
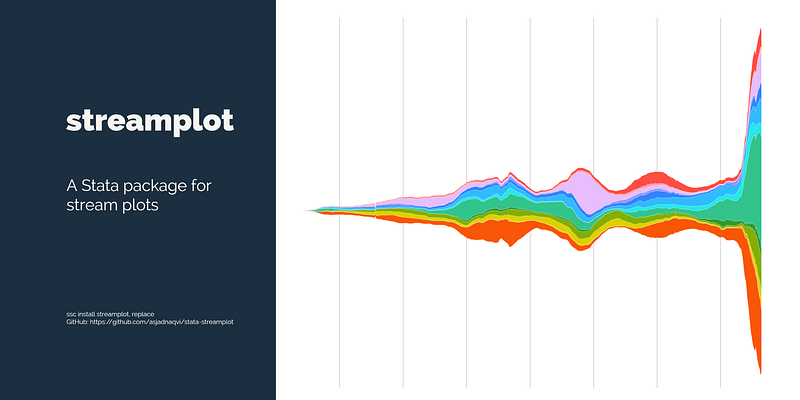
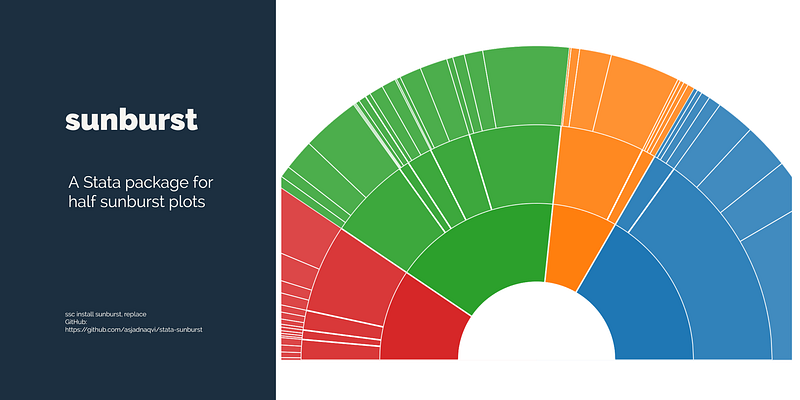
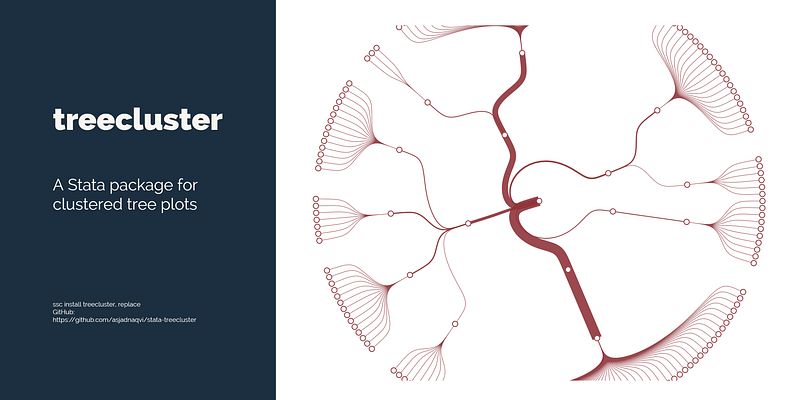
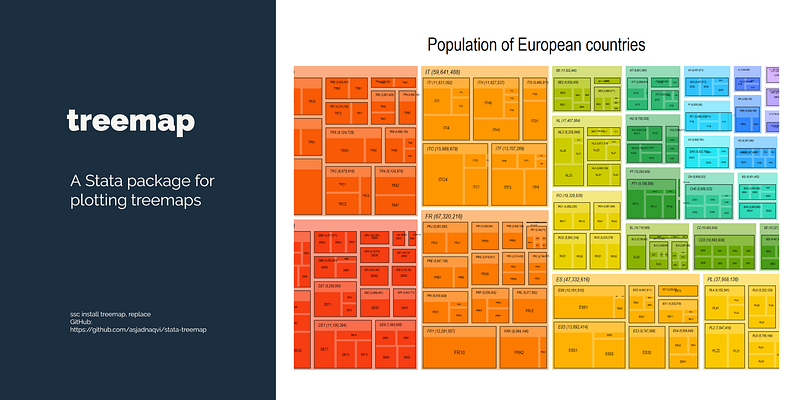
Each package has it’s own GitHub respository where the latest versions are released:
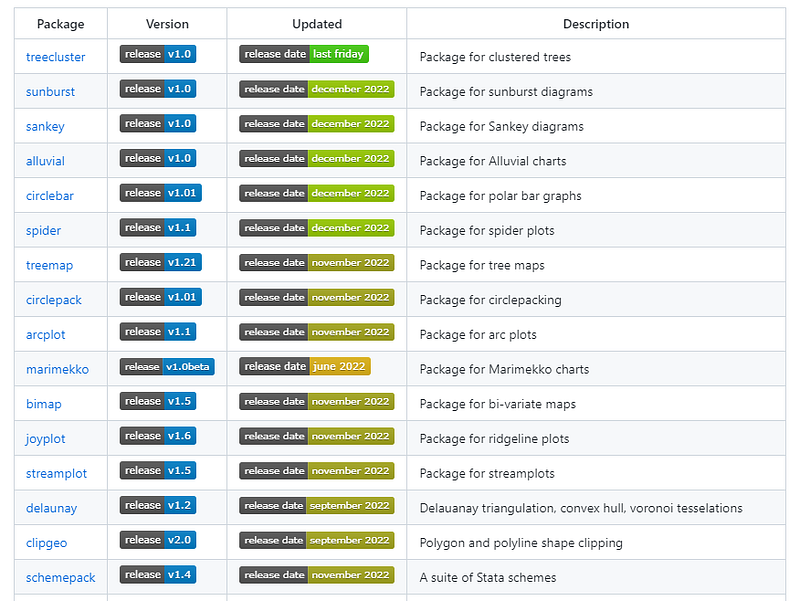
These releases are also pushed to SSC to allow users to easily install them: ssc install <packagename>, replace.
I will be slowly updating the guides as well to redirect users to move on to the packages. The guides are still relevant in case you want to go for a high level of customization for very specific applications. But if you are looking for single-line commands, then please install the relevant packages and start with their documentation and examples.
2) The Stata Gallery on Medium was launched:
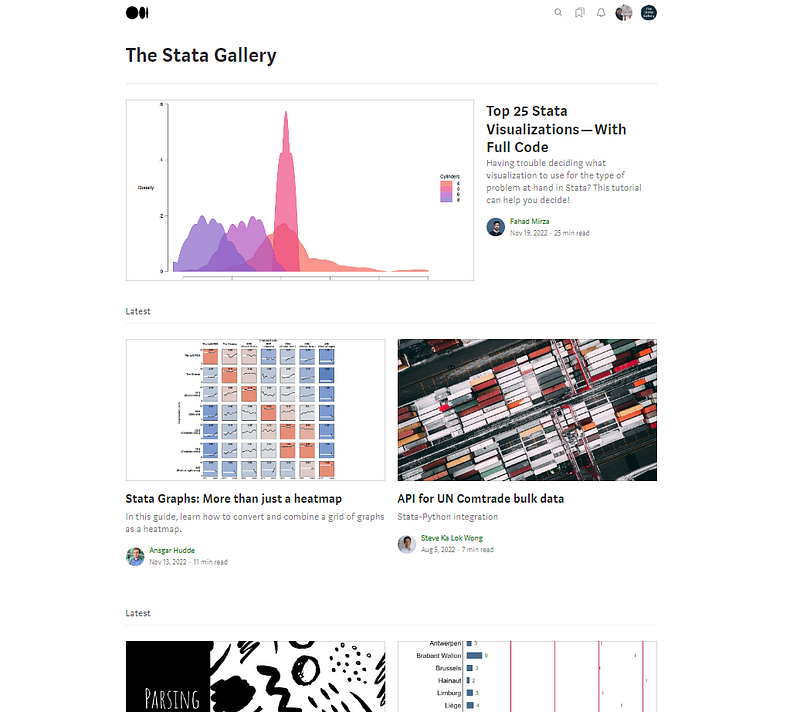
This space allows Stata users to submit their awesome articles on data visualizations, programming, and various innovative content. If you have some amazing code, or program, or tip to share, then please reach out if you want to contribute!
3) I launched my Stata visualization, or StataViz portfolio on a dedicated website:
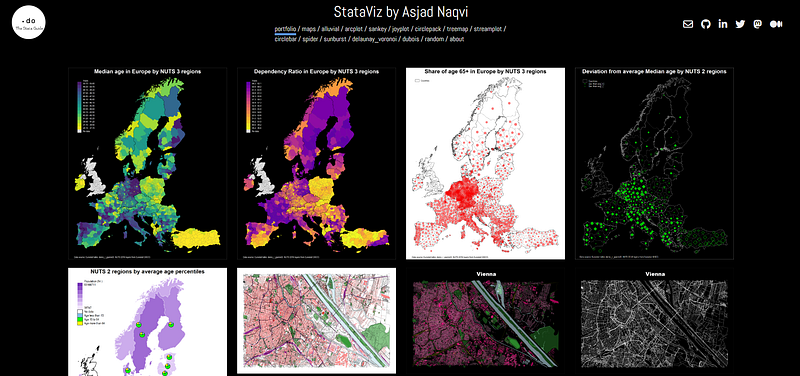
It contains all the visualizations from 2020 onwards. It also helps me showcase the power of Stata and centralizes all my work in one place. Check it out!
If you are not on Twitter or LinkedIn or even the recently-launched Mastodon, then you probably missed all this action in 2022. It was a year of intensive coding and learning new programming skills. Each package brought with it new challenges, and solving them was the exciting part. Some packages were also followed by a barage of requests to fix bugs, add features, and various other enhancments. The post package-release engagement was a good litmus test of how much they are being used.
The development focus of 2022 was also anchored to the three Stata conferences — Oceania (Feb), UK (Sep), and Switzerland (Nov)— which provided natural deadlines to release new packages. You can view the presentations on the Stata Guide’s GitHub repository.
Some of the earlier (and relatively easier) dataviz guides posted on Medium were converted into ado files. The demand was fairly high and honestly, most Stata users probably do not want to go the extra mile to write a massive script just to make one fancy graph. Furthermore, the Stata Guide was reaching a point where further data visualization guides would have meant going into extremely long, programming-heavy articles. Since I track my stats for articles on Medium and on social media, this was definitely not worth the hassle. Viewership and readership for similar articles is already very low! You can see this entry that periodically tracks the statistics:
In contrast, the easy-to-use dataviz packages and customization capabilities now gives me a lot of material to write about! Additionally, programming all these packages myself gives me the creative control to make sure that the aesthetics remain central to the visualizations. Thus, a lot of effort was put into getting the color palettes, marker sizes, line widths, and a bunch of other elements right. Most of the visually appealing aspects have been added as defaults so you get the right visual feel even with the most basic use.
So expect more dataviz articles in 2023!
About the author
I am an economist by profession and I have been using Stata since 2003. I am currently based in Vienna, Austria. You can see my profile, research, and projects on GitHub or my website. You can connect with me via Medium, Twitter, LinkedIn, Mastodon, Post, or simply via email: [email protected]. If you have questions regarding the Guide or Stata in general post them on The Code Block Discord server.
The Stata Guide releases awesome new content regularly. Subscribe, Clap, and/or Follow the guide if you like the content!