
Unraveling the Mysteries of Group Differences: The Power of ANOVA in Statistical Analysis
Introduction
In the realm of statistical analysis, understanding and interpreting the differences between groups is a fundamental endeavor. Analysis of Variance, commonly known as ANOVA, stands as a cornerstone in this quest, offering a robust and comprehensive framework for testing the equality of means across different groups. This essay delves into the intricacies of ANOVA, exploring its methodology, applications, and significance in statistical analysis.
In the symphony of statistics, ANOVA plays the crucial role of a conductor, harmonizing disparate groups to reveal a deeper understanding of their differences and similarities.
The Conceptual Framework of ANOVA
ANOVA is a statistical method used to compare the means of three or more groups to ascertain if at least one group mean significantly differs from the others. It is particularly useful when dealing with categorical independent variables and a continuous dependent variable. The essence of ANOVA lies in partitioning data variance into components attributable to different sources of variation.
Understanding the Hypotheses in ANOVA
ANOVA operates on two fundamental hypotheses: the null hypothesis, which posits that all group means are equal, and the alternative hypothesis, which suggests that at least one group mean differs. The technique is designed to ascertain whether observed differences among group means are substantial enough to reject the null hypothesis.
Decomposing Variance: Between-Group and Within-Group Variability
A pivotal aspect of ANOVA is the decomposition of variance into between-group and within-group components. Between-group variability reflects differences among the group means, while within-group variability indicates the variance within each group. The ratio of these variances forms the F-statistic, a key metric in ANOVA. A high F-statistic suggests more variance between groups than within, pointing towards significant group mean differences.
The Role of the F-Statistic and P-Value in ANOVA
The F-statistic, derived from the ratio of between-group to within-group variance, is the cornerstone of ANOVA. It is used to calculate the P-value, which indicates the probability of observing such an F-statistic if the null hypothesis were true. A low P-value (typically ≤ 0.05) is indicative of significant differences among group means, leading to the rejection of the null hypothesis.
Types of ANOVA and Their Applications
ANOVA is a versatile tool with several variations. One-Way ANOVA, the simplest form, analyzes differences across groups with a single categorical independent variable. Two-Way ANOVA, more complex, evaluates two categorical independent variables and their interaction effect. These methods find applications in diverse fields like psychology, medicine, agriculture, and economics, providing insights into phenomena ranging from treatment effects to behavioral patterns.
Adhering to Assumptions in ANOVA
ANOVA’s validity hinges on certain assumptions: normal distribution of residuals, homoscedasticity (equal variances), and independence of observations. Violations of these assumptions can lead to erroneous conclusions, making it crucial to verify them before proceeding with ANOVA.
Post Hoc Analysis in ANOVA
When ANOVA indicates significant differences, post hoc tests like Tukey’s test are employed to pinpoint exactly which group means differ. This step is essential for a thorough understanding of the specific differences between groups.
Theorical
ANOVA, or Analysis of Variance, is a statistical method used to test differences between two or more means. It’s commonly used when you have a continuous outcome variable and one or more categorical explanatory variables. The primary goal of ANOVA is to determine whether the differences among group means are statistically significant.
Here’s a basic overview of how ANOVA works:
- Hypotheses:
- Null hypothesis (H0): The means of different groups are equal.
- Alternative hypothesis (H1): At least one group mean is different from the others.
- Between-Group Variability and Within-Group Variability:
- ANOVA compares the variance (variability) between different groups with the variance within each of these groups.
- Between-Group Variability: Variability due to the interaction between the samples. If the group means are very different, this variability will be large.
- Within-Group Variability: Variability within each group. If each group’s data points are close to the mean, this variability will be small.
- F-Statistic:
- ANOVA calculates the F-statistic, a ratio of the between-group variability to the within-group variability. A higher F-statistic indicates that there is more variation between groups than within groups.
- P-Value:
- The P-value is calculated from the F-statistic. It tells you the probability of obtaining an F-statistic as extreme as, or more extreme than, the one calculated from your sample data, assuming the null hypothesis is true.
- A low P-value (typically ≤ 0.05) indicates that the group means are not all equal and suggests rejecting the null hypothesis.
- Types of ANOVA:
- One-Way ANOVA: Used when there’s one categorical independent variable.
- Two-Way ANOVA: Used when there are two categorical independent variables. It can also assess the interaction effect between these variables.
- Assumptions:
- The residuals (the differences between the observed and predicted values) should be normally distributed.
- Homoscedasticity (equal variances) of the residuals.
- Independence of observations.
ANOVA is a powerful method because it allows comparisons of more than two groups at the same time, but it’s important to ensure that its assumptions are met to obtain valid results. If significant differences are found, post hoc tests (like Tukey’s test) are often used to determine exactly which means are different.
Code
Let’s create a complete Python code example that uses ANOVA with a synthetic dataset and includes plots to visualize the results. We’ll follow these steps:
- Generate a synthetic dataset.
- Perform ANOVA using the
scipylibrary. - Visualize the data and the results using plots.
First, we’ll need to import necessary libraries. We’ll use numpy for data generation, pandas for data manipulation, scipy.stats for performing ANOVA, and matplotlib for plotting.
Here’s the code outline:
- Generate a Synthetic Dataset:
- Create three different groups with slightly different means.
- Combine these groups into a single dataset.
- Perform ANOVA:
- Use the
f_onewayfunction fromscipy.statsto perform a one-way ANOVA.
- Visualize the Data:
- Use
matplotlibto create boxplots for each group to visualize the differences.
Let’s write and execute this code.
The ANOVA test on the synthetic dataset has been successfully executed, and the results are as follows:
- F-value: 17.296
- P-value: 4.74×10−74.74×10−7
The F-value is quite high, and the P-value is significantly lower (much less than 0.05). This indicates that there are statistically significant differences among the means of the three groups.
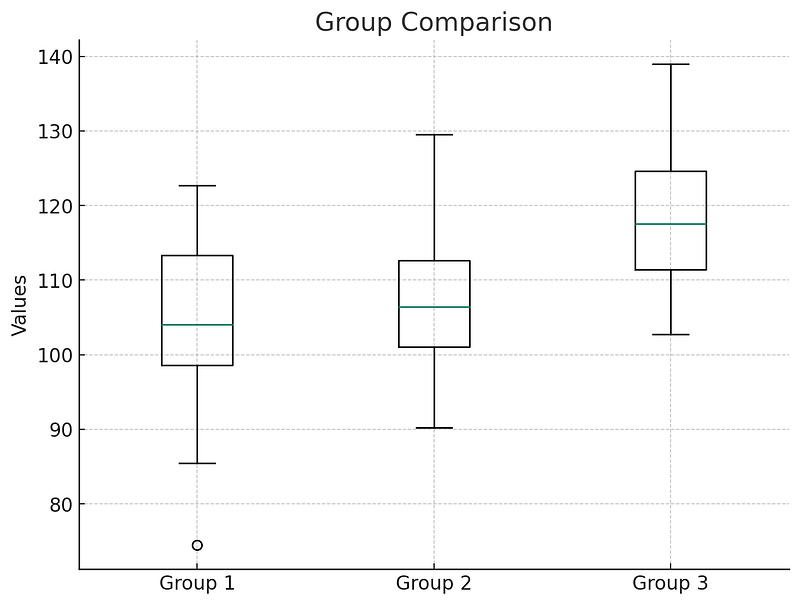
The boxplot visually represents these differences. Each boxplot shows the distribution of values in each group, with the central line in the box representing the median. The spread and position of these boxplots highlight the variance and mean differences across the groups. As seen in the plot, Group 3 has the highest mean values, followed by Group 2 and then Group 1.
import numpy as np
import pandas as pd
from scipy import stats
import matplotlib.pyplot as plt

# Step 1: Generate a Synthetic Dataset
np.random.seed(0)  # for reproducibility
group1 = np.random.normal(100, 10, 30)  # Group 1 with mean 100
group2 = np.random.normal(110, 10, 30)  # Group 2 with mean 110
group3 = np.random.normal(120, 10, 30)  # Group 3 with mean 120

# Combining groups into a single DataFrame
data = pd.DataFrame({
    'value': np.concatenate([group1, group2, group3]),
    'group': np.array(['Group1'] * 30 + ['Group2'] * 30 + ['Group3'] * 30)
})

# Step 2: Perform ANOVA
f_value, p_value = stats.f_oneway(group1, group2, group3)

# Step 3: Visualize the Data
plt.figure(figsize=(8, 6))
plt.boxplot([group1, group2, group3], labels=['Group 1', 'Group 2', 'Group 3'])
plt.title('Group Comparison')
plt.ylabel('Values')
plt.grid(True)
plt.show()

f_value, p_value  # Displaying the ANOVA results (F-value and P-value)
In summary, both the ANOVA results and the visual representation through the boxplot suggest that the groups have significantly different means.
Conclusion
ANOVA is a powerful statistical tool that unveils the dynamics of group differences. Its ability to simultaneously compare multiple groups sets it apart in the statistical toolbox. By decomposing variance and employing the F-statistic, ANOVA offers a structured approach to hypothesis testing. While it requires adherence to certain assumptions, its application across various fields underscores its versatility and importance. In the quest to discern and interpret group differences, ANOVA remains an invaluable ally for researchers and statisticians alike.
PlainEnglish.io 🚀
Thank you for being a part of the In Plain English community! Before you go:
- Be sure to clap and follow the writer️
- Learn how you can also write for In Plain English️
- Follow us: X | LinkedIn | YouTube | Discord | Newsletter
- Visit our other platforms: Stackademic | CoFeed | Venture


