
Statistical Modelling: Variance Inflation Factor (VIF) in Regression Analysis. Detecting and Addressing Multicollinearity
Gain insights into the Variance Inflation Factor (VIF) and its role in identifying multicollinearity in regression models. Learn how to interpret VIF values, diagnose correlated independent variables, and enhance model stability.
Variance Inflation Factor (VIF) is a statistical measure that quantifies the extent of multicollinearity in a regression analysis.
Multicollinearity occurs when independent variables in a regression model are highly correlated with each other, which can lead to unreliable and unstable estimates of the regression coefficients.
The VIF of a particular independent variable measures how much the variance of the estimated regression coefficient is inflated due to multicollinearity. A high VIF indicates a high degree of multicollinearity, suggesting that the corresponding independent variable is highly correlated with other predictors in the model.
The VIF is calculated as follows:
VIF = 1 / (1 — R²)
where R² represents the coefficient of determination of the regression model when the independent variable in question is regressed on all the other independent variables in the model.
To understand the mathematical formulation of VIF, let’s consider a multiple linear regression model with p independent variables:
Y = β₀ + β₁X₁ + β₂X₂ + … + βₚXₚ + ɛ
where Y is the dependent variable, X₁, X₂, …, Xₚ are the independent variables, β₀, β₁, β₂, …, βₚ are the regression coefficients, and ɛ is the error term.
To calculate the VIF for the ith independent variable, we regress Xᵢ on all the other independent variables in the model:
Xᵢ = α₀ + α₁X₁ + α₂X₂ + … + αᵢ₋₁Xᵢ₋₁ + αᵢ₊₁Xᵢ₊₁ + … + αₚXₚ + ɛᵢ
where Xᵢ is the ith independent variable, X₁, X₂, …, Xᵢ₋₁, Xᵢ₊₁, …, Xₚ are the other independent variables, α₀, α₁, α₂, …, αᵢ₋₁, αᵢ₊₁, …, αₚ are the regression coefficients, and ɛᵢ is the error term.
We then calculate the coefficient of determination (R²) of this regression model, which represents the proportion of the variance in Xᵢ that can be explained by the other independent variables.
The VIF for the ith independent variable is given by:
VIFᵢ = 1 / (1 — R²)
A VIF of 1 indicates no multicollinearity, as there is no correlation between the independent variable and the other predictors.
Generally, a VIF value greater than 1 indicates the presence of multicollinearity, with higher values indicating stronger multicollinearity. As a rule of thumb, a VIF value exceeding 5 or 10 is often considered problematic and suggests a high degree of multicollinearity.
The interpretation of VIF is that it quantifies the inflation in the variance of the estimated regression coefficient due to multicollinearity. For example, a VIF of 2 means that the variance of the estimated coefficient is twice as large as it would be in the absence of multicollinearity.
Researchers often use VIF as a diagnostic tool to identify highly correlated independent variables and assess the impact of multicollinearity on the regression model’s stability and reliability.
If high multicollinearity is detected, it may be necessary to take appropriate measures, such as removing one or more correlated predictors, to address the issue and improve the model’s performance.
Let’s look at a code:
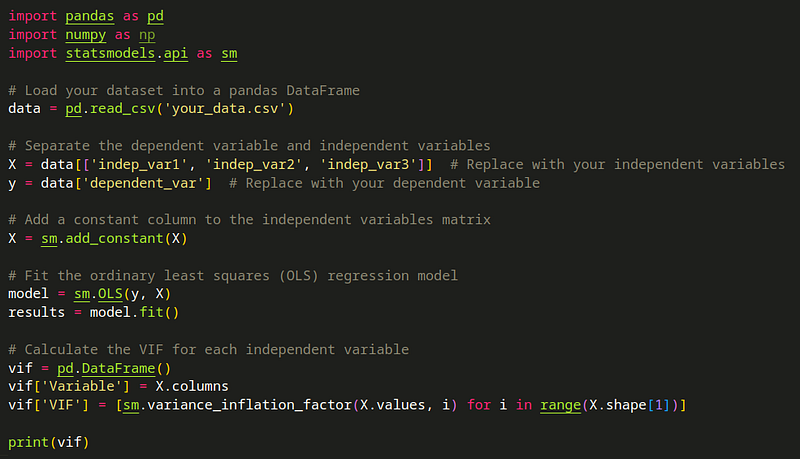
In this code, we assume you have your dataset stored in a CSV file (your_data.csv) and that you have identified the dependent variable (dependent_var) and independent variables (indep_var1, indep_var2, indep_var3) you want to include in your regression model.
The code uses the statsmodels library to fit an ordinary least squares (OLS) regression model and calculate the VIF for each independent variable. The sm.add_constant() function is used to add a constant column to the independent variables matrix, which is necessary for the regression model. Then, the sm.OLS() function is used to fit the model, and the sm.variance_inflation_factor() function is applied to calculate the VIF for each independent variable.
The resulting VIF values are stored in a pandas DataFrame (vif), which includes the variable names and their corresponding VIF values. You can then print or further analyze this DataFrame to assess the presence and magnitude of multicollinearity in your regression model.
#RegressionAnalysis, #VarianceInflationFactor, #Multicollinearity, #StatisticalAnalysis, #DataScience, #Modeling, #DataAnalytics, #Correlation, #VariableSelection, #ModelPerformance, #DiagnosticTool, #ResearchMethods, #DataModelling, #OLSRegression, #DataInsights, #MachineLearning, #ModelReliability, #DataPreprocessing, #StatisticalMeasure, #IndependentVariables, #DependentVariable, #DataVisualization, #DataExploration, #DataMining, #DataHandling


