Understanding the Silhouette Score
Introduction
Clustering is a cornerstone of unsupervised machine learning, and assessing the quality of clustering is crucial. One effective method for evaluating clustering algorithms is the Silhouette Score. This metric helps in determining the separation distance between the resulting clusters. Understanding this score is key to enhancing the effectiveness of cluster analysis.
What is the Silhouette Score?
The Silhouette Score is a measure of how similar an object is to its own cluster (cohesion) compared to other clusters (separation). The silhouette ranges from -1 to +1, where a high value indicates that the object is well matched to its own cluster and poorly matched to neighboring clusters. If most objects have a high value, then the clustering configuration is appropriate. If many points have a low or negative value, then the clustering configuration may have too many or too few clusters.
The Mathematics Behind the Silhouette Score
The Silhouette Score for each point is calculated using the following formula:
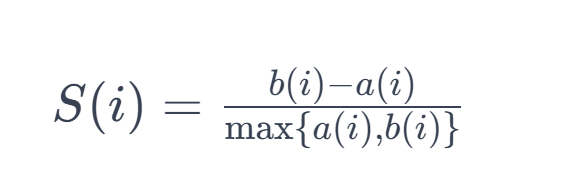
- a(i): The average distance from the ith point to the other points in the same cluster.
- b(i): The minimum average distance from the ith point to points in a different cluster, minimized over clusters.
When to Use Silhouette Score
The Silhouette Score is particularly useful in the following scenarios:
- When you want to validate the consistency within clusters of data.
- To determine the optimal number of clusters.
- To visualize the quality and separation distance of the formed clusters.
Limitations of Silhouette Score
Despite its usefulness, the silhouette score has limitations:
- It may not perform well with clusters of varying densities.
- High dimensional data can reduce its effectiveness.
Let’s dive into the Python code for this implementation.
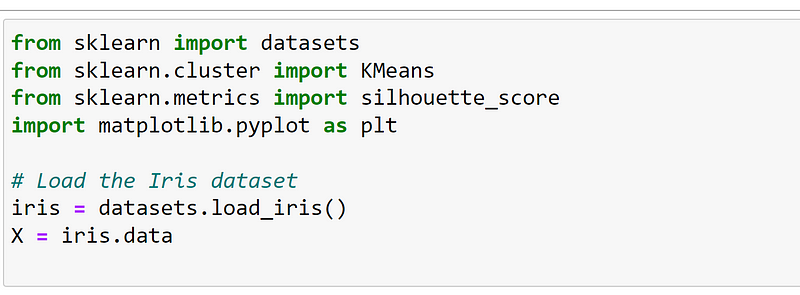
Step 1: Loading the Dataset and Preparing the Environment
Now, let’s load the Iris dataset and import required libraries:
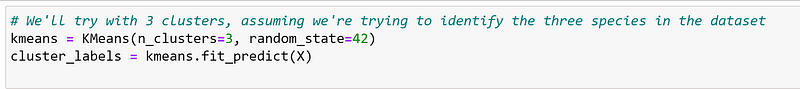
Step 2: Applying K-Means Clustering
We will apply K-Means clustering to the Iris dataset. The number of clusters is often chosen based on domain knowledge; in the case of the Iris dataset, we know there are three species of Iris, so we’ll use three clusters.
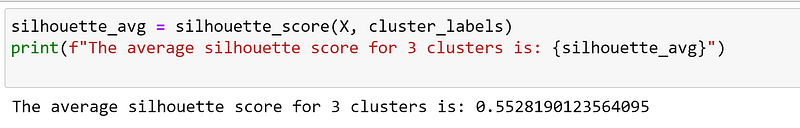
Calculating the Silhouette Score
Now, we calculate the silhouette score, which will give us an idea of how well-separated the clusters are:
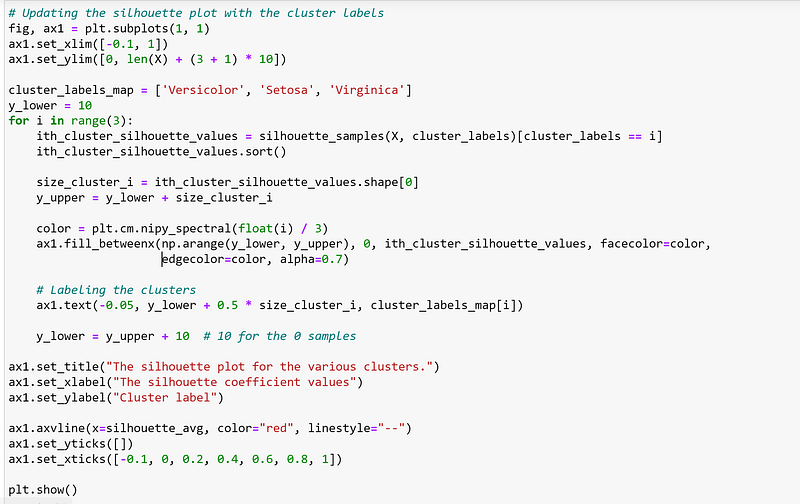
Bonus: Visualizing the Clusters
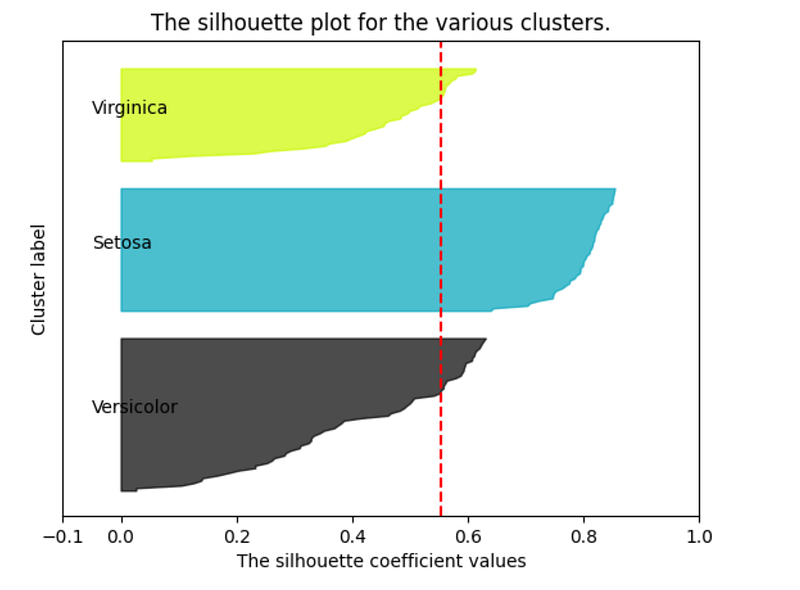
Interpretation
Cluster Separation and Cohesion:
- The plot shows silhouette coefficients of individual samples in each cluster.
- Values close to +1 indicate that the sample is far away from its neighboring clusters, whereas values close to 0 indicate that the sample is on or very close to the decision boundary between two neighboring clusters.
Clusters and Iris Species:
- The ‘Setosa’ cluster is very well-defined, with high silhouette coefficients, suggesting that this species is distinctly separated from the other two.
- The ‘Versicolor’ and ‘Virginica’ clusters show some overlap and lower silhouette coefficients, indicating that these species are not as clearly separable as ‘Setosa’. This is consistent with the known characteristics of the Iris dataset, where Versicolor and Virginica are more similar to each other than to Setosa.
Average Silhouette Score:
- The red dashed line indicates the average silhouette score.
- The ‘Setosa’ cluster exceeds the average by a significant margin, reinforcing its distinct nature.
- The ‘Versicolor’ and ‘Virginica’ clusters are closer to the average, indicating moderate separation.
Cluster Sizes:
- The thickness of each color band (cluster) represents the number of samples in that cluster.
- All three clusters have a substantial number of samples, indicating a relatively balanced distribution of data points among the clusters.
Overall Assessment:
- The plot suggests that the K-Means clustering algorithm has effectively separated the Setosa species from the others.
- The Versicolor and Virginica species are less distinctly separated, which is a known characteristic of these species as they are similar to each other.
Conclusion
The Silhouette Score is a powerful metric for cluster validation in Python. It allows you to objectively assess the quality of clusters and make informed decisions about the number of clusters to use in your analysis. By following the steps outlined in this blog post, you can apply the Silhouette Score to your own datasets and improve the effectiveness of your clustering tasks.
If you found this article interesting, your support by following below steps will help me spread the knowledge to others:
👏 Give the article 20 claps and hit the follow button
Follow me on LinkedIn
📚 Read more articles on Medium


