
Understanding the Sensitivity Analysis Results in Detail (Morris&Sobol from SALib)
Last year I posted an article about using the SALib to analyse the sensitivity: Sensitivity Analysis(Feature Importance) with SALib on the Boston Housing Price Project. It’s a simple toy example that only gives Morris analysis results and roughly indicates the most important features. However, the results can be explained in much more detail.
- What is Morris
- What is Sobol
- How to read the results from SALib
0. Terminology
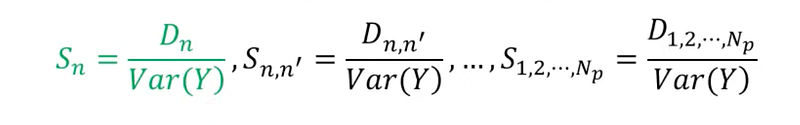
(1) Sensitivity index
When we’re trying to figure out how much each thing we put into a system affects the output, we use something called a sensitivity index. There are a few different types of sensitivity indices:
First-order indices: these tell us how much one thing we put in affects the output all by itself. Second-order indices: these tell us how much two things we put in together affect the output. Total-order index: this one considers how much one thing affects the output on its own, as well as how much it affects the output when combined with other things.
(2) Local & Global sensitivity analysis
Local sensitivity analysis is used to measure the sensitivity of the system output to small perturbations in the input variables around a specific point. It provides information about how changes in input variables affect the system's output in the immediate vicinity of that point.
Global sensitivity analysis, on the other hand, considers the entire range of values that the input variables can take and evaluates how changes in these variables impact the system output over the entire range. It is used to identify the most important input variables and their relative importance in contributing to the output.
1. What is Morris
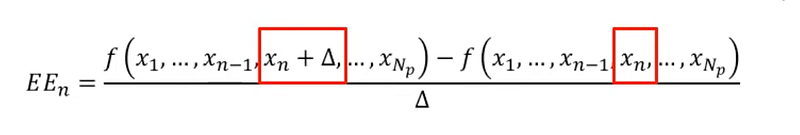
It is a local sensitivity analysis method based on once-at-a-time(OAT). The OAT method involves varying one feature while holding the others constant and observing the resulting changes in output. However, OAT requires a baseline (e.g. the features’ mean values)to calculate the variance, which can affect the resulting sensitivity index if different baselines are chosen.
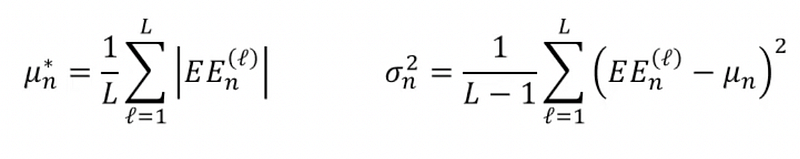
The Morris method was developed to address this issue, which uses multiple baselines and randomizes the OATs to calculate the average variance. These results consist of the mean and deviation of the system outputs.
The mean reflects the impact of the feature, while the deviation indicates the non-linearity of that feature.
2. What is Sobol
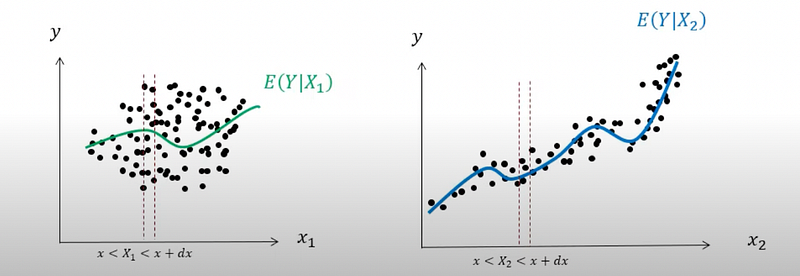
Sobol is a type of global sensitivity analysis method that focuses on variance. Specifically, it looks at how the output variance can be explained by different input variables. This is done by measuring the variance of the conditional expectation of the output relative to the total output variance.

One advantage of using Sobol over Morris is that Sobol can provide information about feature interactions. This means that in addition to analyzing individual features, Sobol can also show how different features interact with each other and affect the output. This can help understand the underlying relationships within the system being analyzed.
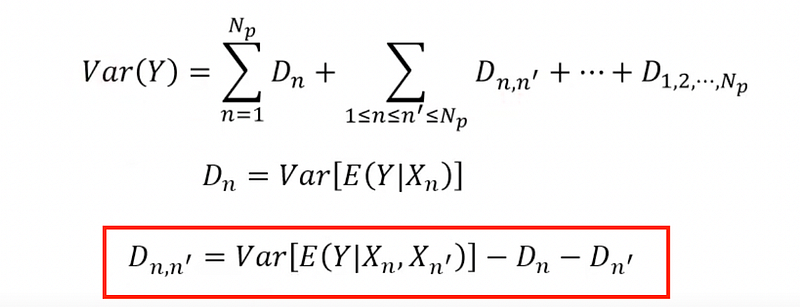
So, from Sobol, we obtain the first-order index and total effect index(summing all n-order indices)
3. How to read the results from SALib
Based on the understanding above, the results can be explained in detail. Before jumping to the result, you might want to know how to use SALib to get the results A Example on how to use SALib.
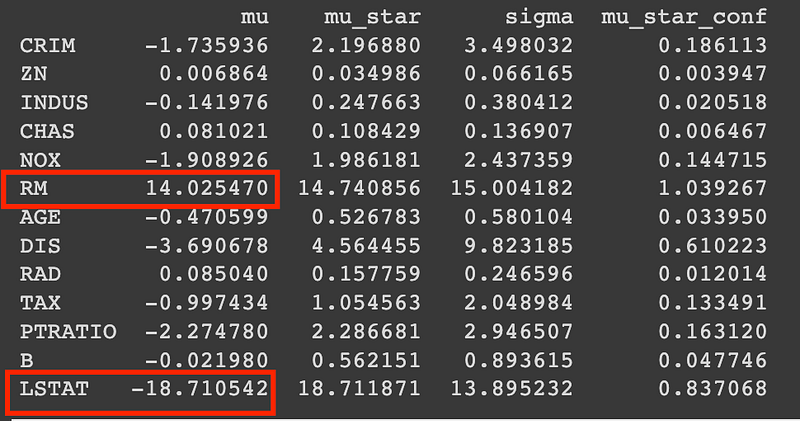
This is the Morris result from the example. Mu_star is the absolute value mentioned in the above formula, and sigma is the deviation. mu_star_conf refers to the confidence interval.
Take another result for Sobol from its documentation — Ishigami Function Example.
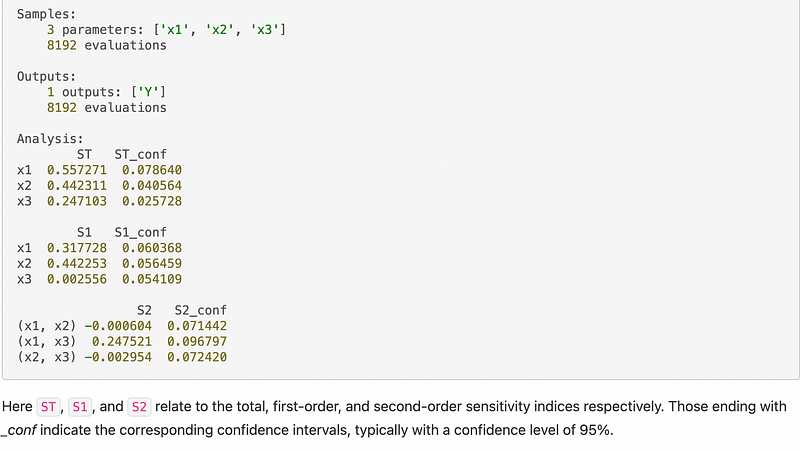
The closer the S1 to ST, the fewer interactions exist among the features.
Thanks for reading, if you found this post helpful, you could also read
- Calculating Feature Importance with Permutation to Explain the Model
- Explainable AI with SHAP — Income Prediction Example
- Time Series Data Clustering — Unsupervised Sequential Data Separation with Tslean
- Anomaly Detection with Python Library PyOD — Time Series Voltage Data Outlier Detection Example
- Multi-dimensional Data Visualization with Plotly (3D-7D)
- How to Tune Hyperparameters with Weights and Biases(W&B Sweeps)


