
Understanding Maximum Likelihood Estimation (MLE) in Machine Learning
Maximum Likelihood Estimation (MLE) is a fundamental concept in machine learning and statistics that plays a crucial role in parameter estimation for probabilistic models. It forms the backbone of many algorithms and techniques used in modern data-driven applications. In this blog, we will explore the concept of Maximum Likelihood Estimation, its importance, and how it is applied in various machine learning scenarios.
What is Maximum Likelihood Estimation?
Maximum Likelihood Estimation is a statistical method used to estimate the parameters of a probabilistic model based on observed data. The goal of MLE is to find the set of parameter values that maximize the likelihood function, which measures the probability of observing the given data under the assumed model.
Let’s understand the key components of MLE:
1. Likelihood Function: The likelihood function, denoted by L(θ | D), is a function of the model parameters θ and the observed data D. It represents the probability of observing the data D given a specific value of the parameters θ. For independent and identically distributed (i.i.d.) data, the likelihood is often expressed as the product of the individual data point probabilities.
2. Log-Likelihood Function: In practice, it is common to work with the log-likelihood function, denoted by log L(θ | D), which is the natural logarithm of the likelihood function. Taking the logarithm makes computations easier and helps prevent numerical underflow for large datasets.
3. MLE Objective: The MLE objective is to find the parameter values θ that maximize the log-likelihood function:
θ_MLE = argmax log L(θ | D)
Implementation:
Let’s walk through a simple example of Maximum Likelihood Estimation using Python. We’ll create a synthetic dataset and then use MLE to estimate the parameters of a Gaussian distribution that generated the data.
import numpy as np
import matplotlib.pyplot as plt
from scipy.stats import norm
# Generating synthetic data from a Gaussian distribution with known parameters
np.random.seed(42)
true_mean = 5.0
true_std = 2.0
num_samples = 100
data = np.random.normal(loc=true_mean, scale=true_std, size=num_samples)
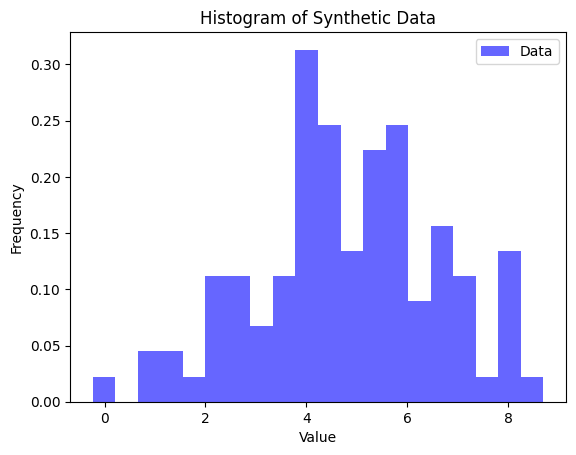
# Visualization of the data distribution
plt.hist(data, bins=20, density=True, alpha=0.6, color='b', label='Data')
plt.title('Histogram of Synthetic Data')
plt.xlabel('Value')
plt.ylabel('Frequency')
plt.legend()
plt.show()
# Maximum Likelihood Estimation for Gaussian distribution
def gaussian_likelihood(x, mu, sigma):
return np.prod(norm.pdf(x, loc=mu, scale=sigma))
# MLE for mean and standard deviation
def maximum_likelihood_estimation(data):
estimated_mean = np.mean(data)
estimated_std = np.std(data, ddof=1) # Using Bessel's correction (ddof=1) for unbiased estimation
return estimated_mean, estimated_std
estimated_mean, estimated_std = maximum_likelihood_estimation(data)
# Visualization of the original and estimated Gaussian distributions
x = np.linspace(0, 10, 100)
original_distribution = norm.pdf(x, loc=true_mean, scale=true_std)
estimated_distribution = norm.pdf(x, loc=estimated_mean, scale=estimated_std)
plt.plot(x, original_distribution, 'r', label='Original Gaussian')
plt.plot(x, estimated_distribution, 'g', linestyle='--', label='Estimated Gaussian')
plt.hist(data, bins=20, density=True, alpha=0.6, color='b', label='Data')
plt.title('Original and Estimated Gaussian Distributions')
plt.xlabel('Value')
plt.ylabel('Probability Density')
plt.legend()
plt.show()
print(f"True Mean: {true_mean}, True Std: {true_std}")
print(f"Estimated Mean: {estimated_mean}, Estimated Std: {estimated_std}")In this example, we first generate synthetic data points from a Gaussian distribution with known parameters true_mean and true_std. We then plot the histogram of the generated data to visualize its distribution.
Next, we define a function gaussian_likelihood to compute the likelihood of observing the data under a Gaussian distribution with given mean mu and standard deviation sigma.
The maximum_likelihood_estimation function calculates the MLE estimates for the mean and standard deviation based on the observed data.
We plot the original Gaussian distribution (in red) with the true parameters and the estimated Gaussian distribution (in green dashed line) using the MLE estimates. The histogram of the data is also plotted to compare it with the estimated Gaussian.
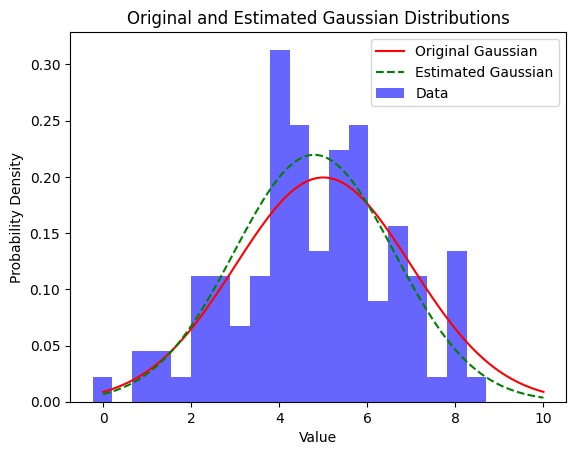
Finally, we print the true and estimated mean and standard deviation. Note that the estimated values may not match the true parameters exactly due to the random nature of the generated data, but they should be close to the true values for a sufficiently large dataset.
The importance of MLE in Machine Learning:
MLE is a versatile and widely used method in machine learning for various reasons:
1. Unifying Framework: MLE provides a unified framework for parameter estimation in probabilistic models. Whether it’s estimating parameters for simple models like linear regression or complex models like neural networks, MLE can be applied consistently.
2. Asymptotic Properties: Under certain regularity conditions, MLE has desirable asymptotic properties. It is asymptotically unbiased, consistent, and has the smallest variance among consistent estimators, making it an attractive choice for large datasets.
3. Maximum Likelihood Estimators: The parameter values obtained through MLE are known as Maximum Likelihood Estimators. These estimators are intuitive and have strong theoretical foundations, making them easy to interpret and analyze.
Applications of MLE in Machine Learning:
MLE finds applications in various areas of machine learning, including:
1. Linear Regression: MLE is used to estimate the regression coefficients in linear regression models, which aim to predict a continuous output based on input features.
2. Logistic Regression: In classification tasks, MLE is employed to find the optimal parameters for logistic regression models, which predict the probability of binary outcomes.
3. Gaussian Mixture Models (GMM): MLE is used to estimate the parameters of GMMs, a probabilistic model commonly used for clustering and density estimation.
4. Hidden Markov Models (HMM): MLE is applied to estimate the transition probabilities and emission probabilities in HMMs, frequently used for sequential data modeling.
Maximum Likelihood Estimation is a powerful and widely adopted technique in machine learning and statistics. It provides a solid foundation for estimating the parameters of probabilistic models based on observed data. Understanding MLE is crucial for anyone working in data-driven fields, as it enables us to make informed decisions, build accurate models, and gain deeper insights from data. By leveraging the principles of MLE, machine learning practitioners can harness the power of probabilistic modeling to tackle real-world challenges effectively.


