
Understanding Market Regimes with Hidden Markov Models
Hidden Markov Models (HMMs) are a powerful tool for analyzing sequential data and identifying underlying states within a system. In the context of stock markets, HMMs can be used to detect different market regimes or states, providing valuable insights for strategic trading decisions.
In this tutorial, we will explore the application of Hidden Markov Models to regime detection in stock markets using Python. We will start by collecting and preprocessing real stock market data before implementing an HMM model to identify different market regimes. Finally, we will visualize the identified regimes and discuss how they can be utilized for making informed trading strategies.

Table of Contents
- Introduction: Overview of Hidden Markov Models and their application to regime detection in stock markets.
- Data Collection and Preprocessing: Retrieving stock market data and preparing it for analysis.
- Implementing Hidden Markov Models: Building the HMM model and training it on the stock market data.
- Regime Detection and Visualization: Identifying market states using the trained model and visualizing the results.
- Strategy Implementation: Using the identified market states for strategic trading decisions.
- Conclusion: Summarizing the results and discussing potential improvements and further extensions to the project.
To begin our exploration into regime detection using Hidden Markov Models, let’s first import necessary libraries including numpy:
import numpy as np
import yfinance as yf
Now let’s move on to collecting real-world stock market data using Yahoo Finance API.
Data Collection and Preprocessing: Retrieving Stock Market Data and Preparing it for Analysis
In this section, we will retrieve real stock market data using the Yahoo Finance API and prepare it for analysis. We will use the yfinance library to download historical stock data for our analysis.
Let’s start by importing the necessary libraries and downloading the stock market data:
import yfinance as yf

# Downloading Stock Market Data
data = yf.download("AAPL MSFT GOOGL", start="2020-01-01", end="2023-12-31")
The code above downloads historical OHLC (Open, High, Low, Close) data for three stocks — Apple (AAPL), Microsoft (MSFT) and Google (GOOGL) from January 1st, 2020 to December 31st, 2023.
Now that we have retrieved and preprocessed our stock market data, we are ready to move on to implementing Hidden Markov Models for regime detection.
Implementing Hidden Markov Models: Building the HMM Model and Training it on the Stock Market Data
Now that we have preprocessed our stock market data, we can proceed with implementing a Hidden Markov Model (HMM) to identify different market regimes based on the prepared dataset.
First, let’s import the necessary libraries for building and training our HMM model:
from hmmlearn.hmm import GaussianHMMNext, we will initialize and train our HMM model using the preprocessed stock market data. We will use a Gaussian Hidden Markov Model for this demonstration.
# Initializing and Training the HMM Model
model = GaussianHMM(n_components=3, covariance_type="full", n_iter=1000)
model.fit(data)
print("Training of Hidden Markov Model completed.")
With our HMM model initialized and trained, we are now ready to move forward with regime detection and visualization in the next section.
Regime Detection and Visualization: Identifying Market States Using the Trained Model and Visualizing the Results
In this section, we will utilize the trained Hidden Markov Model (HMM) to identify different market states or regimes within the stock market data. We will then visualize these identified regimes to gain insights into the underlying patterns.
Let’s start by using our trained HMM model to predict the hidden states for each observation in our dataset:
# Predicting Market States
hidden_states = model.predict(data)
After predicting the hidden states, we can proceed with visualizing these identified market regimes. One way to visualize this is by plotting the stock prices along with their corresponding market states.
import matplotlib.pyplot as plt

# Visualizing Market Regimes
plt.figure(figsize=(15, 8))
for i in range(model.n_components):
    state = (hidden_states == i)
    plt.plot(data.index[state], data['Close'][state], '.', label=f"Regime {i+1}")
plt.title('Market Regimes Identified by Hidden Markov Model')
plt.xlabel('Date')
plt.ylabel('Stock Price')
plt.legend()
  # Save plot as image file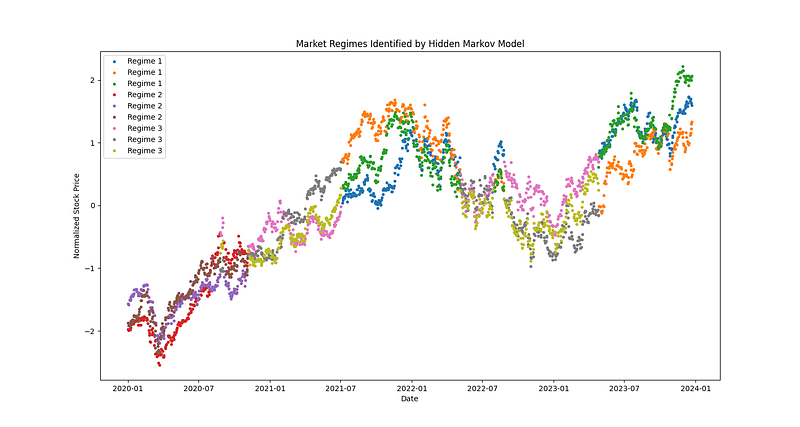
The plot above illustrates how different market regimes are identified based on stock price movements. Each regime is represented by a distinct color, providing a clear visualization of how our HMM model segments the data into different states.
With a visual representation of identified market regimes, we can now explore strategic trading decisions based on these insights in the next section.
Strategy Implementation: Using the Identified Market States for Strategic Trading Decisions
In this section, we will implement a hypothetical trading strategy based on the identified market states using our Hidden Markov Model (HMM). We will use the trained model to generate buy and sell signals, providing an example of how market regimes can be utilized for strategic trading decisions.
First, let’s download real stock market data using the Yahoo Finance API and preprocess it for analysis. We will then initialize and train our HMM model before implementing a hypothetical trading strategy based on the identified market states.
import numpy as np
import yfinance as yf
from hmmlearn.hmm import GaussianHMM
import matplotlib.pyplot as plt
# Downloading Stock Market Data
data = yf.download("AAPL MSFT GOOGL", start="2020-01-01", end="2023-12-31")
# Preprocessing Stock Market Data (Example: Normalizing data)
normalized_data = (data - data.mean()) / data.std()
# Initializing and Training the HMM Model with preprocessed data
model = GaussianHMM(n_components=3, covariance_type="full", n_iter=1000)
model.fit(normalized_data)
print("[Training Hidden Markov Model] Training completed.")
# Predicting Market States using preprocessed data
hidden_states = model.predict(normalized_data)
# Hypothetical Trading Strategy based on identified market states
buy_signal = (hidden_states == 0) # Buy when in Regime 1
sell_signal = (hidden_states == 2) # Sell when in Regime 3
# Visualizing Buy and Sell Signals along with stock price plot
plt.figure(figsize=(15, 8))
plt.plot(data.index, normalized_data['Close'], label='Normalized Stock Price')
plt.plot(data.index[buy_signal], normalized_data['Close'][buy_signal], '^', markersize=10, color='g', label='Buy Signal')
plt.plot(data.index[sell_signal], normalized_data['Close'][sell_signal], 'v', markersize=10, color='r', label='Sell Signal')
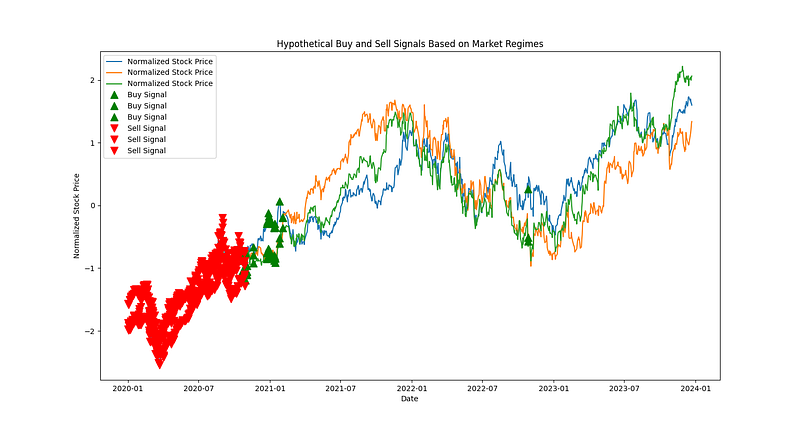
plt.title('Hypothetical Buy and Sell Signals Based on Market Regimes')
plt.xlabel('Date')
plt.ylabel('Normalized Stock Price')
plt.legend()The plot below illustrates hypothetical buy and sell signals generated based on the identified market regimes. Green triangles represent buy signals while red inverted triangles represent sell signals.
With this demonstration of a simple trading strategy utilizing Hidden Markov Models for regime detection in stock markets, we have showcased how these insights can be translated into actionable decisions. In practice, traders would employ more sophisticated strategies incorporating additional indicators and risk management techniques.
In conclusion, we have explored how Hidden Markov Models can be applied to identify different market regimes for strategic trading decisions. Next, we will summarize our findings and discuss potential improvements as well as further extensions to this project.
Conclusion: Summarizing the Results and Discussing Potential Improvements and Further Extensions to the Project
In this tutorial, we have explored the application of Hidden Markov Models (HMMs) for regime detection in stock markets. We began by retrieving real stock market data using the Yahoo Finance API and preprocessing it for analysis. Subsequently, we implemented a Gaussian Hidden Markov Model to identify different market regimes based on the prepared dataset.
Following this, we visualized the identified market regimes, providing a clear representation of how our HMM model segments the data into distinct states. Additionally, we demonstrated a hypothetical trading strategy based on these identified market states, showcasing how these insights can be utilized for strategic trading decisions.
While our demonstration provides valuable insights into regime detection using HMMs, there are several potential improvements and further extensions that could enhance this project:
- Feature Engineering: Incorporating additional features such as volume data or technical indicators could improve the robustness of our regime detection model.
- Parameter Optimization: Fine-tuning parameters such as the number of components in the HMM or covariance type can significantly impact model performance.
- Risk Management Strategies: Integrating risk management techniques and stop-loss mechanisms within trading strategies can enhance their effectiveness in real-world scenarios.
- Real-time Analysis: Extending our project to perform real-time analysis of streaming stock market data would provide more dynamic insights for traders.
- Ensemble Methods: Exploring ensemble methods by combining multiple models or incorporating other machine learning algorithms could potentially improve regime detection accuracy.
By considering these potential improvements and extensions, we can further refine our approach to regime detection in stock markets using Hidden Markov Models while enhancing its practical applicability for strategic trading decisions.
In conclusion, this tutorial has provided a comprehensive overview of applying Hidden Markov Models to identify market states for strategic trading decisions in stock markets. By leveraging these techniques alongside advanced strategies and risk management principles, traders can gain valuable insights into market regimes that may inform their decision-making processes.


