
Understanding K-Means, K-Means++ and, K-Medoids Clustering Algorithms
An overview of K-means, K-means++ and, K-Medoids clustering algorithms, and their relations. This article also includes its implementation from scratch and using the sklearn library.

Clustering is an unsupervised machine learning technique that divides the population or data points into several groups or clusters such that data points in the same groups are more similar to other data points in the same group and dissimilar to the data points in other groups.
- Points in the same cluster are closer to each other.
- Points in the different clusters are far apart.
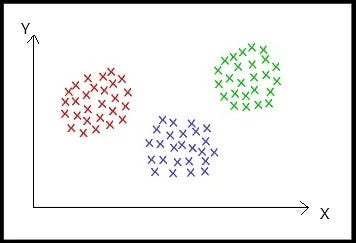
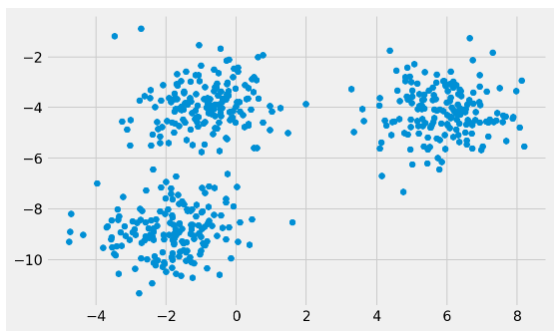
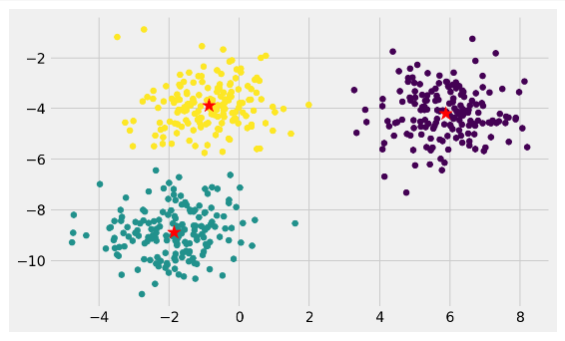
In the above sample 2-dimension dataset, it is visible that the dataset forms 3 clusters that are far apart, and points in the same cluster are close to each other.
What is the Metric for Clustering?
Clustering is considered to be best if it has maximum intercluster distance and minimum intracluster distance.
Notes to avoid any confusion:Intracluster distance: Distance between two point in the same cluster.
Intercluster distance: Distance between two points in the different clusters.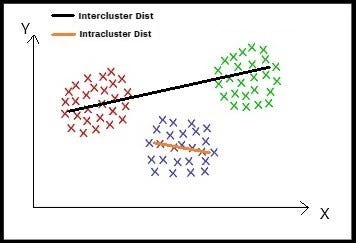
The image above (Image 2), describes what is an intercluster and intracluster distance.
Various evaluation metrics are using which the effectiveness of formed clusters can be measured.
Dunn Index:

The numerator of the above function measures the maximum distance between every two points (x_i, x_j) belonging to two different clusters. This represents the intracluster distance.
The denominator of the above function measures the maximum distance between every two points (y_i, y_j) belonging to the same cluster. This represents the intercluster distance.
Clustering having the max value of Dunn-Index is considered to be best.
Silhouette analysis:

This is used to determine the degree of separation between clusters. For each sample. a_i represents the average distance from all data points in the same cluster. b_i represents the average distance from all data points in the closest cluster.
The coefficient of SA can take values in the interval [-1, 1].
- SA = 0: the sample is very close to the neighboring clusters.
- SA = 1: the sample is far away from the neighboring clusters.
- SA = -1: the sample is assigned to the wrong clusters.
Therefore, we want the coefficients to be as big as possible and close to 1.
There are different types of Clustering technique, we will discuss one of them.
K-Means Clustering:
K-Means algorithm is a centroid based clustering technique. This technique cluster the dataset to k different cluster having an almost equal number of points. Each cluster is k-means clustering algorithm is represented by a centroid point.
What is a centroid point?
The centroid point is the point that represents its cluster. Centroid point is the average of all the points in the set and will change in each step and will be computed by:

For the above equation,
C_i: i'th Centroid
S_i: All points belonging to set_i with centroid as C_i
x_j: j'th point from the set
||S_i||: number of points in set_i
The idea of the K-Means algorithm is to find k-centroid points and every point in the dataset will belong either of k-sets having minimum Euclidean distance.
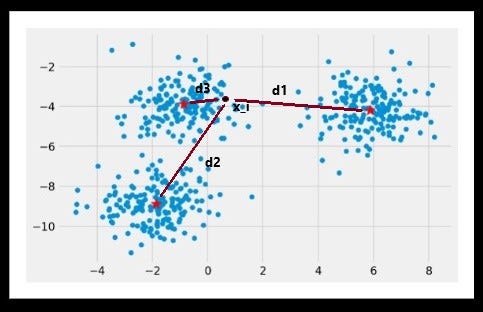
From the image above (Image 3), the distance of point x_i from all three centroids are d1, d2, d3, x_i point is nearest to centroid_3 with distance d3, so the point x_i will belong to the cluster of centroid_3 and this process will continue for all the points in the dataset.
Cost Function of K-Means:

The idea of the K-Means algorithm is to find k centroid points (C_1, C_1, . . . C_k) by minimizing the sum over each cluster of the sum of the square of the distance between the point and its centroid.
This cost is NP-hard and has exponential time complexity. So we use the idea of approximation using Lloyd’s Algorithm.
Lloyd’s Algorithm:
Lloyd’s algorithm is an approximation iterative algorithm used to cluster points. The steps of the algorithm are as follows:
- Initialization
- Assignment
- Update Centroid
- Repeat Step 2 and 3 until convergence.
Iterative implementation of the K-Means algorithm:
Steps #1: Initialization:
The initial k-centroids are randomly picked from the dataset of points (lines 27–28).
Steps #2: Assignment:
For each point in the dataset, find the euclidean distance between the point and all centroids (line 33). The point will be assigned to the cluster with the nearest centroid.
Steps #3: Updation of Centroid:
Update the value of the centroid with the new mean value (lines 39–40).
Steps #4: Repeat:
Repeat steps 2 and 3 unless convergence is achieved. If convergence is achieved then break the loop(line 43). Convergence refers to the condition where the previous value of centroids is equal to the updated value.
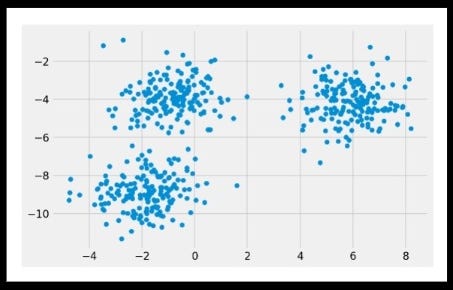
Results:
Plot for the initial dataset (Image 4)
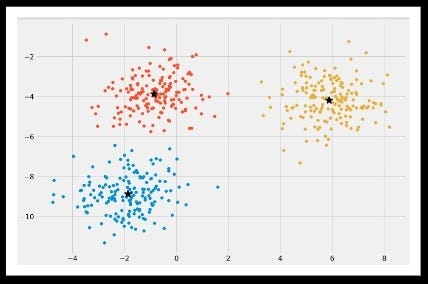
Clustering result plot for k=2 (Image 5)
Clustering result plot for k=3 (Image 6)
K-Means++ Clustering:
In the case of finding initial centroids using Lloyd’s algorithm for K-Means clustering, we were using randomization. The initial k-centroids were picked randomly from the data points.
This randomization of picking k-centroids points results in the problem of initialization sensitivity. This problem tends to affect the final formed clusters. The final formed clusters depend on how initial centroids were picked.
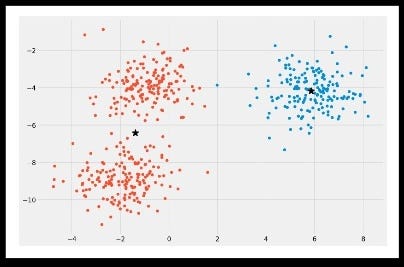
Here are some outcomes of clustering where the initialization of centroids was different:
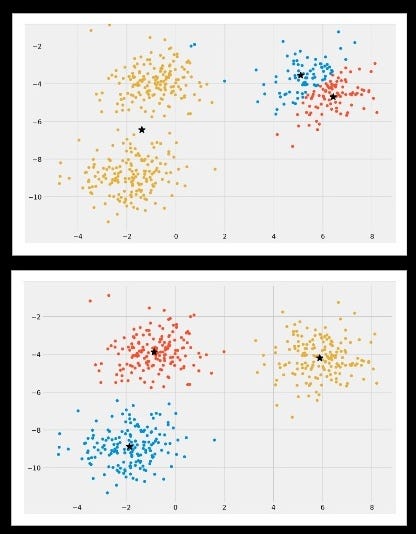
In the above image above (Image 7), the final formed clusters are different becomes the final formed clusters are dependent on the initialization of centroids. In the 1st part of the above image, it is observed that centroids (black *) and the clusters are not properly formed. In the 2nd part of the above image, it observed that centroids (black *) and the clusters are properly formed.
There are two approaches to avoid this problem of initialization sensitivity:
- Repeat K-means: Repeating the algorithm and initialization of centroids several times and pick the clustering approach that has small intracluster distance and large intercluster distance.
- K-Means++: K-Means++ is a smart centroid initialization technique.
The above two methods can be used to avoid the problem of initialization sensitivity but amongst the two K-Means++ is the best approach.
How K-Means++ works?
K-Means++ is a smart centroid initialization technique and the rest of the algorithm is the same as that of K-Means. The steps to follow for centroid initialization are:
- Pick the first centroid point (C_1) randomly.
- Compute distance of all points in the dataset from the selected centroid. The distance of x_i point from the farthest centroid can be computed by

d_i: Distance of x_i point from the farthest centroid
m: number of centroids already picked- Make the point x_i as the new centroid that is having maximum probability proportional to d_i.
- Repeat the above two steps till you find k-centroids.
Implementation of K-Means++ using sklearn:
Above we have discussed the iterative approach of K-Means from scratch, for implementation of the K-Means++ algorithm we will use the sklearn library.
Walkthrough of the Implementation and Results:
- Load or create the dataset (line 8)
- Implement the k-means++ algorithm for the dataset (line 9)
- Plot the raw dataset to observe the dataset (lines 25–26).
- Find the k-centroid points
- Plot the clustering result (rounded circle) along with k-centroid (red *) (lines 29–32).
K-Medoids Clustering:
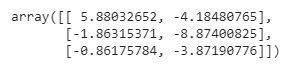
A problem with the K-Means and K-Means++ clustering is that the final centroids are not interpretable or in other words, centroids are not the actual point but the mean of points present in that cluster. Here are the coordinates of 3-centroids that do not resemble real points from the dataset.
The idea of K-Medoids clustering is to make the final centroids as actual data-points. This result to make the centroids interpretable.
The algorithm of K-Medoids clustering is called Partitioning Around Medoids (PAM) which is almost the same as that of Lloyd’s algorithm with a slight change in the update step.
Steps to follow for PAM algorithm:
- Initialization: Same as that of K-Means++
- Assignment: Same as that of K-Means
- Update centroids: In the case of K-Means we were computing mean of all points present in the cluster. But for the PAM algorithm updation of the centroid is different. If there are m-point in a cluster, swap the previous centroid with all other (m-1) points from the cluster and finalize the point as new centroid that have a minimum loss. Minimum loss is computed by below cost function:

- Repeat: Same as that of K-Means
How to pick the best value of K?
The best value of K can be computed using the Elbow method. The cost function of K-Means, K-Means, and K-Medoids techniques is to minimize intercluster distance and maximize intracluster distance. This can be achieved by minimizing the loss function discussed above in the article:

To determine the right ‘K’, draw a plot between loss vs k.
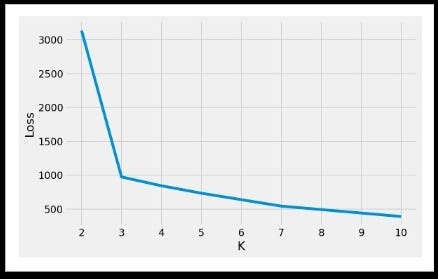
For the above plot, it is observed that with the increase in the value of ‘k’, loss decreases. To find the best value of ‘k’ as to draw k-clusters, we can pick k=3.
Thank You for Reading!


