
Understanding Axes and Dimensions | Numpy | Pandas
Know how to apply a function along the various axis in Data.

I am going to explain a really basic but important topic, Axes and Dimensions. Many people find it quite confusing, especially using axis while applying a function on multi-dimensional data.
Axis or dimensions is a very generic concept. Whether you are handling data in Numpy, Pandas, TensorFlow, or another library, you have to encounter it frequently. And the concepts I am going to explain will be common across all these libraries.
What is the Axis?
In simple words, the Axis is something that represents the dimension of data. Let’s go through various examples to understand it at its core.
Zero Dimensional data
A Scalar is zero-dimensional data. It has no dimensions or axis.
4
One Dimensional data
A Vector is one-dimensional data. Vector is a collection of Scalars. Vector has a shape (N,) , where N is the number of scalars in it.
[1,2,3,4]The vector has one axis since it is one dimensional. So you can only apply a function across axis-0. Axes are always 0 indexed.
np.sum([1,2,3,4], axis=0)>> 10Two Dimensional data
A Matrix is an example of two-dimensional data. Matrix is a collection of vectors and has a shape of (N,M) , where N is the number of vectors in it and M is the number of scalars in each vector.
The shape of the following example matrix would be(2,3).
[[1,2,3],
 [4,5,6]]
Matrix is a 2-dimensional data so it has 2 axes. Let’s see how to apply a Sum function along both axes.
Applying Sum function
Taking sum across axis-0 means we are summing all vectors together.
data = [[1,2,3],[4,5,6]]np.sum(data, axis=0)>> [5, 7, 9]Taking sum across axis-1 means, we are summing all scalars inside a vector.
data = [[1,2,3],[4,5,6]]np.sum(data, axis=1)>> [6, 15]You can also choose to not provide any axis in the arguments. Doing so you will get a sum of all elements together. Means function is applied to all the elements present in the data irrespective of the axis.
data = [[1,2,3],[4,5,6]]np.sum(data)>> [21]Three Dimensional data
Similarly, 3D data is a collection of 2D data-points(matrix). The shape of 3D data would be (N,M,P). There would be N matrices of shape (M,P).
The shape of the following 3-dimensional data would be(2,2,3).
[[[1,1,1],
  [3,3,3]],
[[2,2,2],
[4,4,4]]]Applying Sum Function
- Applying sum function across
axis-0means you are summing all matrices together. - Applying sum function across
axis-1means you are summing all vectors inside each metrics. - Applying sum function across
axis-2means you are summing all scalars inside each Vector.
Generalizing the Concept
Let’s extend this concept for any number of dimension. A data with n dimension would be having the following shape.
(N1, N2, N3 ..... Nn)- There are
N1data-points of shape(N2, N3 .. Nn)alongaxis-0. Applying a function acrossaxis-0means you are performing computation between theseN1data-points. - Each data-point along
axis-0will haveN2data-points of shape(N3, N4 .. Nn). TheseN2data-points would be considered alongaxis-1. Applying a function acrossaxis-1means you are performing computation between theseN2data-points. - Similarly, it goes on.
Note
You can use negative indexing for axis as well. axis -1 would be the last axis and axis -2 would be the second last axis.
Multiple datapoints
We were applying the functions within a single datapoint. Let’s see what axis means when we apply a function between multiple data points.
Let’s look at the following example, where we are applying a Sum function on 2 distinct datapoints across axis-0.
data1 = [1,2,3]
data2 = [4,5,6]np.sum((data1, data2), axis=0)>> [5, 7, 9]These data points will be treated as a single data point with a shape of (2,3) as following since there are 2 vectors of length 3.
[[1,2,3],[4,5,6]]Similarly, if there are N distinct data points, you can think of it as a combined single data-points and apply any function as you are applying within a single datapoint.
Axis in Pandas
Similarly in Pandas, you can handle Series as 1 Dimensional data and Dataframe as 2 Dimensional data.
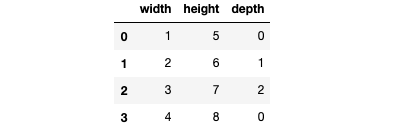
For example, in Dataframe, rows are considered along axis-0 and columns along axis-1. Applying any function across axis-0 means you are performing computation between all rows and applying a function across axis-1 means you are performing computation between all columns.
In this blog, I took an example of Sum function, but there are many more functions you would be performing using axis. This blog is written to build your foundation towards axis and dimension. You would be getting better on it as you would be practicing more and more.


