
Understanding and optimization of Google App Engine's automatic scaling
This article will look at Google App Engine's automatic scaling and optimize its scaling behavior by changing the configuration for the automatic scaling via its app.yaml file.

One important reason for going with the cloud is the ease of scaling. But even with built-in scaling, many can go wrong, and lots of costs can accumulate when not done correctly. Also, it's not obvious how to "scale right", since simply adding "more" isn't always the right choice.
Automatic scaling
Even though Google App Engine has three different types of scaling (automatic, basic, manual), we will only look at the automatic one since it provides the most granular options.
Before taking a closer look at how we can optimize several services, we first go over the different options you can set to define the automatic scaling behavior of App Engine.
Please keep in mind that automatic scaling only works with App Engine instance classes of type F. Also, there are some differences between the standard and flexible environment. In this article, we will use the standard environment.
Scaling elements
At the top of your App Engine configuration file — I will provide a complete code example in the later hands-on section — the element automatic_scaling is available as a root object to define the automatic scaling behavior.
The following children elements are optional and don't need to be set, even though I highly encourage you to do so.
max_instances — The maximum number of instances that Google should start. The value can be between 0 and 2147483647, where 0 disables the setting. You should always set this a few times higher than you would expect on a busy day to prepare your service for a sudden increase in users and traffic. We usually go by around 6-times. So if we know, from monitoring, that we have about 20 instances running on a typical day, we would go with a max_instances of 120.
min_instances — The minimum number of instances that Google should run at any time. Valid values are between 0 and 1000, where 0 means that "scaling to zero" is allowed. But keep in mind that scaling to zero always introduces cold starts. Also, you will always be charged for the running number of instances regardless of whether they receive any traffic. So don't set this too high if you set it at all. We like to set this value to a few, up to 20 instances, especially for our business-critical real-time systems, where we know that a sudden spike in requests can quickly happen. Nevertheless, a min_instances of 0 or 1 should be fine for most non-critical systems.
max_idle_instances — The maximum number of idle instances. Valid values are from 1 to 1000, or automatic, while the latter is the default.
min_idle_instances — The minimum number of idle instances. Google will run the number of instances specified here in addition to the number of active instances that Google spun up due to the automatic scaling algorithm. Valid values are from 1 to 1000, or automatic, while the latter is the default.
target_cpu_utilization — Specifies the CPU utilization at which AppEngine should spin up new instances. Valid values range from 0.5 to 0.95, while 0.6 is the default. If you keep 0.6 as the default value, Google spins up new instances when the current instances reach 60% CPU utilization.
target_throughput_utilization — You can only use this setting in conjunction with max_concurrent_requests. Valid values range from 0.5 to 0.95, while 0.6 is the default. The scheduler tries to start a new instance when the number of concurrent requests on the AppEngine reaches the value defined by target_throughput_utilization * max_concurrent_requests.
max_concurrent_requests — Defines the maximum number of concurrent requests one instance can accept before the scheduler spawns a new instance. The default value is 10, while the maximum is 80. This parameter needs to be used together with target_throughput_utilization, as mentioned already above. Setting this value too high might result in additional latency and decreased performance because each instance handles many more requests. On the other hand, setting it to 1 would only be helpful if you want to spawn one instance per request. Also, it's important to mention that values higher than 10 are only available for instance classes of F2 or higher. F1 doesn't support more than ten concurrent requests.
max_pending_latency — The maximum amount of time a request is allowed to stay in the pending queue. If the request stays longer, the scheduler starts a new instance. So a high value means that the App Engine might take longer to start handling a user's request if there is currently no instance available to serve the request. On the other hand, a low value will trigger a scaling of the App Engine way faster and reduce latency but increase costs due to more instances spinning up. Valid values range from 0.01 to 15.0 seconds, while the provided value has to match the following RegEx ^(?:^(\d+((\.\d{1,3}?s|ms)|automatic)$)$ according to the error message you will receive when providing an invalid value. It is essential to mention that you should not mistake this value with the actual time a request needs to return from the server, but it is the time until the load balancing found a server to assign the request.
min_pending_latency — The minimum amount of time a request is allowed to stay in the pending queue before the scheduler creates a new instance to handle it. Exactly like for the max_pending_latencyvalid values range from 0.01 to 15.0 seconds, while the provided value has to match the following RegEx ^(?:^(\d+((\.\d{1,3}?s|ms)|automatic)$)$.
min_pending_latency works in conjunction with max_pending_latency, and together, they create the following autoscaling behavior:
- A request reaches the application, but no instance is available to serve it, so Google places it in the pending requests queue.
- Until the request reaches the
min_pending_latency: App Engine tries to find an available instance to serve the request and does not create a new instance. - After the time in the queue breaches the
min_pending_latencyand before it reaches themax_pending_latency: App Engine tries to find an available instance to serve the request. - After the request waiting time breached
max_pending_latency: App Engine stops searching for an available instance to serve the request and spawns a new instance.
You can see an example of an app.yaml file where I defined all of the above parameters in the following snippet.
Hands-On
Now that we have quickly checked all possible automatic scaling parameters Google App Engine offers, let's check out a few typical real-world scenarios and see how we can optimize the scaling behavior with the above parameters.
As a "starting point" for our comparisons, we will always use the above-mentioned app.yaml file and then tweak the parameters a bit to improve the scaling behavior of our app.
Also, we will use a "ramping arrival rate" execution for all of our following tests to create traffic. That means that we can define a time range (e.g., 2 minutes) and a target amount of virtual users (VU), and the load test script will automatically scale its VUs until it reaches the target at the end of the timeframe. Chaining these definitions, we can quickly create custom scenarios to simulate changes in traffic. Also, we define that our VUs will make one request per second.
You will notice two lines in the following later images displaying our App Engines instance count. The greenish one represents the currently active instances, and the pink one the idle instances.
You can find the code for the following examples in this GitHub repository.
The scenarios we will look at:
- Many long-running requests
- Compute intensive requests
- Memory intensive requests
Many long-running requests
The first scenario we want to look at is 'many long-running requests .' it doesn't matter that much if they are short or long-running. They only have to be CPU inexpensive. A typical use case here would be a server providing simple data to many clients it fetches from some DB without many modifications and low CPU and Memory requirements.
The endpoint we trigger with each of our VUs is a simple /longRunning endpoint for our demo purposes that waits for five seconds before returning but does nothing except that.
In the following, you can see the definition of the endpoint.
Our scenario:
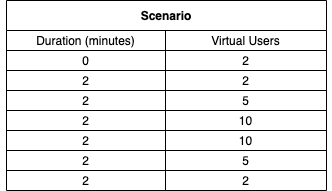
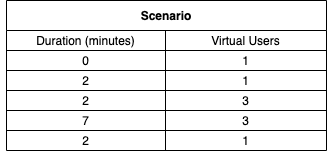
In the above scenario, you can see that we start with two users, stay there for two minutes, and then scale up to five and ten users over two minutes each. Afterward, we remain at ten users for two more minutes and then gradually scale down again.
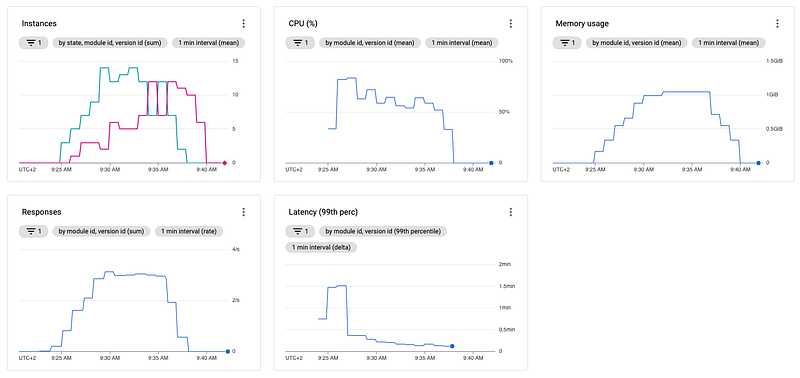
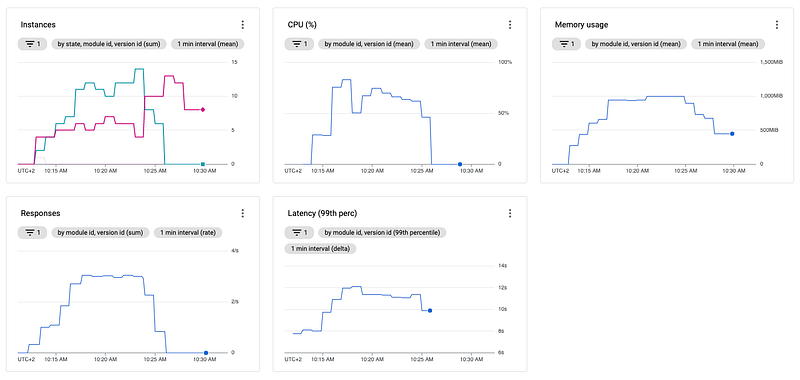
Running the above scenario (12 minutes in total) with our initial app.yaml configuration, we are getting the following metrics in our Google Cloud Monitoring:
The responses and the CPU metrics are pretty straightforward and increase/decrease with the number of requests. At the response metric, we can see that we reach precisely the ten requests/sec we defined earlier as we defined 10 VUs with one request per second in our scenario.
At the latency graph, you can see very well, besides some initial high and a minor hiccup, that the service takes a bit over five seconds to respond, making absolute sense considering the five-second waiting time plus some processing/network overhead. The cold start of the instances, if you are familiar with serverless, you should have experienced it quite often already, is the reason for the initial high. Because as the first requests hit the URL, no servers are running at all since our app.yaml defines a scaling down to zero, so before the instances can handle any request, Google has to spin up the first one, which takes a bit of time.
The memory usage is in tandem with our total instances (active + idle), each having some overhead to run the server code plus the operating system.
But the most interesting/important part here is the instances graph. Here we can see that Google spins up to three instances immediately after receiving the first requests, and after a short amount of time, only two of the three are actively serving requests. That is because, in the beginning, there is no instance available to handle any request at all, so Google spins up more instances till any can handle the requests.
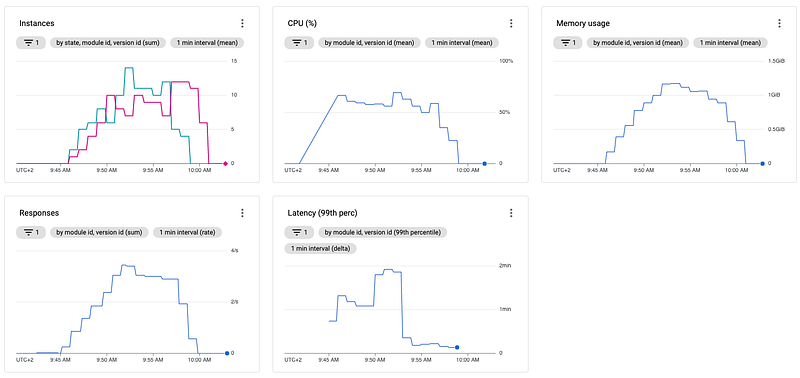
Till we reach the peak of our requests sent, we can observe that scaling works pretty well, and there is just one additional case where one instance is idle, but besides that, all instances are active and responding to requests. Just as we start to decrease our requests again, we can see that we keep having idle instances for quite a long time. In this example, Google shuts down the idle instances at around 07:45 AM, about 12 minutes after the very last request was sent. But this is fine since App Engine is no solution for a "handle one request and then immediately shutdown" case. Also, you don't want too many cold starts here, so keeping instances alive for a few more minutes is okay.
As a workaround, if you want to shut down your instances earlier, you can re-deploy your app and overwrite your previous version. This way, Google shuts down the old instances way quicker.
Taking a closer look at the graphs, you will notice that you have to run and thus pay seven App Engine instances for just handling ten requests/sec, which sounds overkill, mainly since you don't utilize CPU and memory at all, since there are just long-running requests. However, you are still paying for the resources reserved for your instances.
Using the configuration possibilities provided by the app.yaml file, we can easily optimize here. Our default configuration uses a target_throughput_utilization of 0.6 and a max_concurrent_requests of 10, which means that App Engine scales up if the number of requests is greater than the threshold of 6 concurrent requests. Since our server only handles requests without any CPU or memory impact, we can feel safe to increase the max_concurrent_requests to 80 (the maximum available) and thus create a threshold of 48 (80 * 0.6) concurrent requests before App Engine scales up based on concurrent requests. Of course, you should not blindly increase automatic scaling parameters but continuously monitor how your services behave with the new configuration and check for any errors raised in the logs.
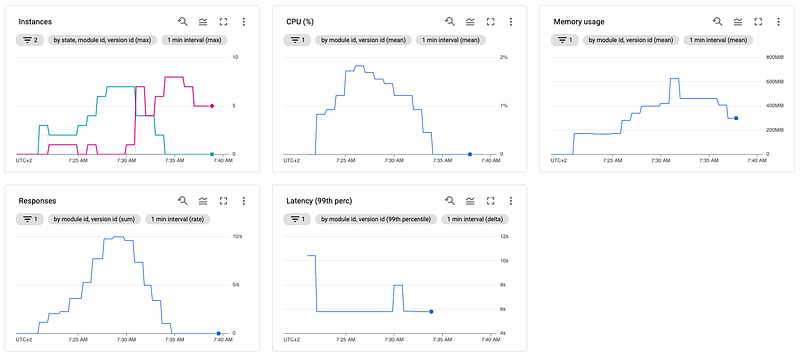
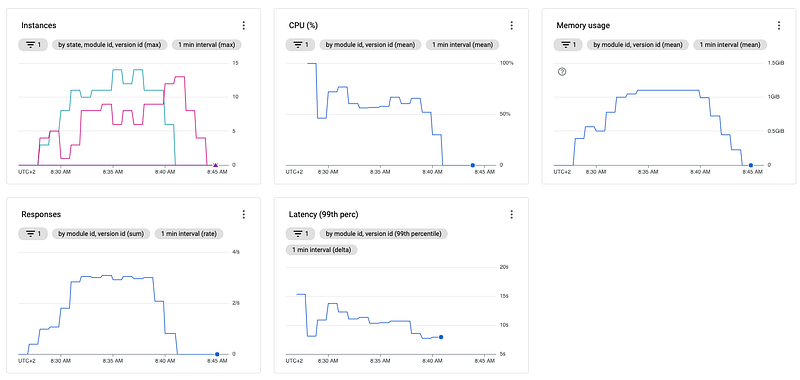
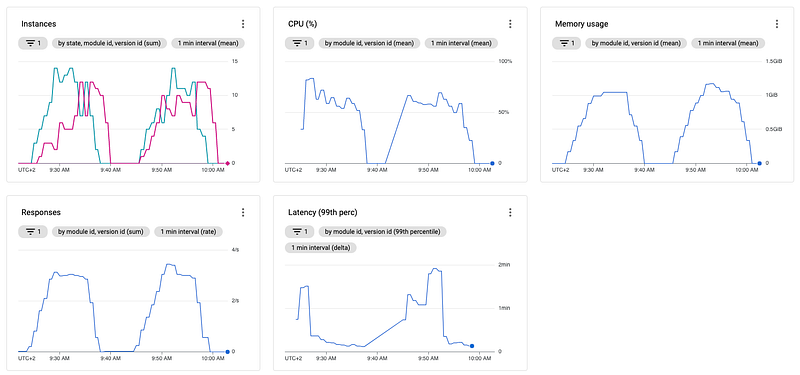
So let's see how our instance scaling behaves after we change the max_concurrent_requests:
You immediately should notice a few differences compared to the last observation:
- The max CPU utilization is around 4% instead of 2%
- The memory used is very constant and way lower than before
- The instances number is very consistent and way lower than before
Now let's quickly check why we see the above differences.
We expected an increase in CPU since we now have more requests per instance, and each request consumes a tiny bit of CPU.
Reduced and more constant memory consumption is also logical since fewer instances run consuming memory. Also, we don't have a lot of up-/downscaling and, as such, constant consumption of memory.
Looking at our instance count, we notice that we start with a single active instance and stick to it until the end of the test. Even though we always have at least one additional instance running idle. There is always one instance idle, and this might sound a bit confusing at first, but it makes sense if you do the math.
We tell App Engine that we want to scale up when breaching our threshold of 48 (80 * 0.6) concurrent requests according to our above configuration change. However, we also know that one request takes at least 5 seconds plus some overhead. Also, we know that we are sending up to 10 requests per second, which means App Engine will need to handle at least 50 (5 sec * 10 requests/sec = 50 requests) concurrent requests while the threshold is around 48 per instance. So it makes absolute sense that there are two instances available, even though one of the two is idle.
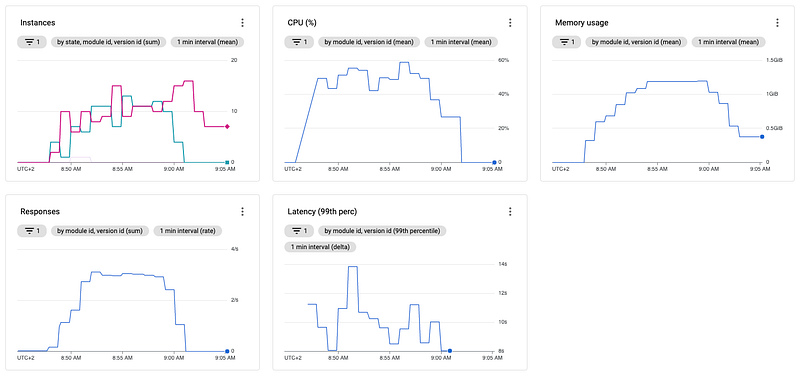
The following image shows the comparison of both configurations and their effects on the scaling behavior right beneath each other.
As you can see, it's relatively easy to cut costs with the proper configuration — i.e., it cost a multiple to have seven instances running compared to two — if you know what kind of load your server needs to handle.
Compute intensive requests
Besides changing the scaling behavior by tweaking the concurrent requests, defining scaling behavior by CPU thresholds is also possible. At the beginning of the article, we learned about the target_cpu_utilization property we can modify in our app.yamlfile. Per default, this property has a value of 0.6. Since we now want to see how we can tweak this property to reduce instances/cost, let us compare our application with our default YAML configuration and the same configuration with an increased target_cpu_utilization of 0.9.
In the following image, you can see the scenario for this test. As you will notice, we have way fewer steps than in the concurrent request's approach and focus more on a steady number of requests after some slight ramp-up.
You can see the endpoint definition we call for this scenario in the following code snippet. The code runs a small but CPU-intensive method and returns when we call the endpoint.
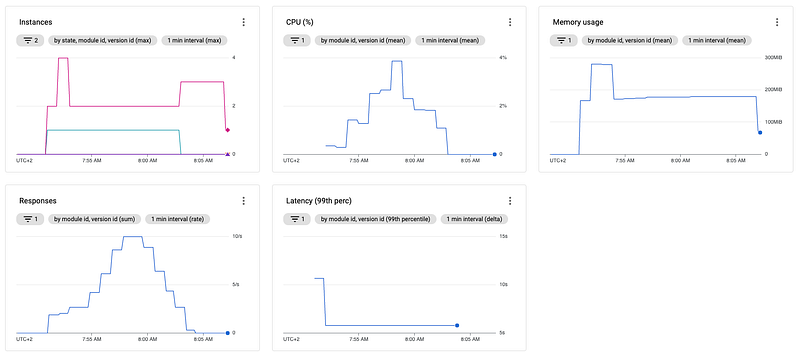
First, let's see how our application scales using our default YAML configuration.
Considering the above monitoring, we can see the CPU utilization oscillating around 60–70%, making absolute sense since our CPU threshold is 0.6 (60%). Also, we see a short 100% spike initially, but this is due to the cold start. After the initial spike, the App Engine "stabilizes".
Also important to notice is that the 99th percentile of our requests latency is around 10 seconds.
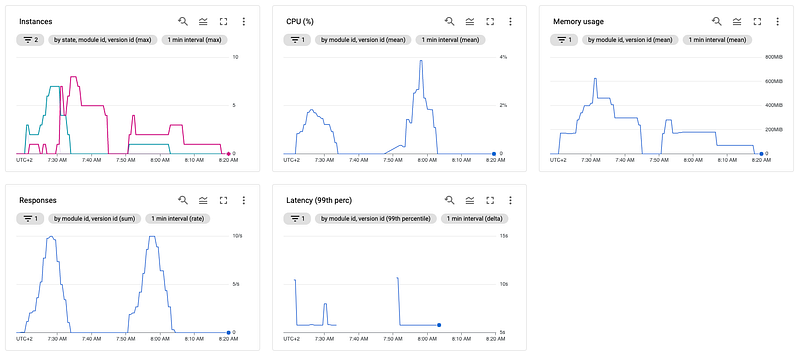
Next, we check out the same scenario with the increased target_cpu_utilization.
And also compare both approaches directly to each other. In the following image, you can see first our "default" configuration and at the second run our setup with the increased target_cpu_utilization.
Comparing the two approaches, you will notice three things.
First, the second setup is a bit more "calm" regarding CPU, but actually, that doesn't mean that much since most fluctuations of the CPU in the first run are in the very beginning as the cold start happened. And as we know, it takes a bit of time for App Engine to "stabilize" after a cold start.
Second, and way more important, the total number of instances doesn't change that much between both runs. But, again, after increasing the threshold value from 60% to 90%, that isn't what one would have expected.
Third, even though we increased our threshold to 90%, the CPU utilization is just around 50%, far lower than expected. Adjusting the threshold to 90% App Engine should scale up when the instances reach this threshold, so we expect the CPU utilization at around 80–90%.
Adding our knowledge from the "Many long-running requests" section and considering that our requests take very long to return, we can conclude one possible cause of our second and third unexpected observations.
The assumed reason App Engine seems not properly scale based on CPU might be the concurrent requests configuration. As we know, we have used our "default" configuration so far as a base of the above tests. In this configuration, the max_concurrent_requests property is still 10. So the obvious assumption is that App Engine has scaled up and down due to this property instead of the CPU threshold, which would explain the above observations.
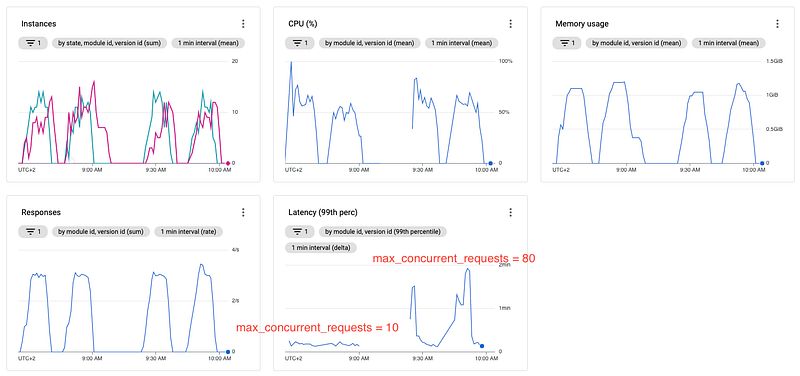
To verify our assumption, let's rerun the above scenarios. But this time, with the max_concurrent_requests property set to 80.
Default configuration with max_concurrent_requests set to 80:
Configuration using max_concurrent_requests = 80 and target_cpu_utilization set to 0.9:
Both configurations compared:
As you can see in the above images, even though our assumption MIGHT be correct, increasing the concurrent requests didn't help but instead harmed our service pretty big, especially in conjunction with the increased target CPU utilization.
Due to the high load, each instance is now allowed to receive 8-times the number of requests which slows down the instances a lot, as you can see when you compare the latency of the graphs.
You can see the following image for easier comparison, displaying the four different configurations we tested above. Here you can especially see how the latency for the max_concurrent_requests=10 case is very consistent and in a reasonable range, while the max_concurrent_requests=80 overloads the server that much that latency increases up to over 1 minute instead of ~10 seconds.
Additionally to the above increase in latency, I also observed quite some failed requests (3.44% of all requests failed with context deadline exceeded error) for the high concurrency (80) high CPU threshold (0.9) case, which I assume are due to HTTP timeout. Checking the official App Engine documentation, Google states that the default HTTP timeout for "automatic scaling" is 1 minute, aligning with the assumption I just provided since we had a few requests taking over 1 minute.
So we now know that simply increasing the concurrent requests doesn't help but instead decreases performance by a lot. So instead of increasing the concurrent requests, lowering them is also possible.
In the following example, I kept the CPU threshold at 0.9 and decreased the maximum concurrent requests to 5.
There is hardly a noticeable difference when comparing this case with the previous runs. That means that the default configuration is already good enough for CPU-intensive loads to use most of the time. Of course, it is always worth experimenting with different configurations and testing if the performance changes. It is also worth mentioning that I used the F2 instance class in all examples, which is by no means the best for compute-intensive tasks. When doing single-threaded CPU-intensive tasks that you can't parallelize, I would always recommend scaling vertically first instead and then horizontally.
Memory intensive requests
Unfortunately, there is no configuration to scale App Engines based on memory consumption. Nevertheless, you can also optimize memory-intensive App Engines using proper monitoring. Therefore, I want to give you a brief introduction to how to scale these high memory services.
The first thing you can do is check out the F4_1G instance class. This instance class has double the memory of the regular F4 and, as such, is the highest memory instance class you can choose as of today. The F4_1g might be a good candidate to use for high-memory applications. But of course, this might not solve the scaling problem yet.
After choosing an appropriate instance class, you should ensure that you don't mix high-memory endpoints with low-memory endpoints on the same App Engine. For example, high-memory endpoints can include returning lists of several thousands of elements, while low-memory endpoints might only return calculations or just one element. Of course, most services out in the world will have a mix of both, but you should consider separating them if you want to optimize your scaling for memory-intensive services.
When you only have your high-memory endpoints left on your service, you can monitor memory usage, over time, via GCP monitoring and check if the memory usage gets near the maximum. Of course, you can also do this with "mixed" endpoints, but that makes the memory consumption way more volatile, depending on how the load balancer distributes the requests between the instances. For example, one instance might get all the high-memory requests, while others get bored with mainly the low-memory ones.
You can easily calculate the maximum memory by multiplying the current instance count with the memory limit of the instance class. For example, the F2 instance class has a memory limit of 512 MB, so if ten active instances are running, we run into issues when breaching the 5 GB (~ 10 * 512MB) mark. Of course, you should take measurements way earlier since you will never want to run out of memory.
If you identify that you hit a particular memory usage threshold, I advise going with around 70%, and regularly, it's time to do something. Besides usual code optimizations, which you should do in either case, the best solution is to reduce the maximum number of concurrent requests because fewer requests mean, of course, less total memory consumption.
So if your service has 40 maximum concurrent requests configured and you regularly hit 70% memory usage, you should consider decreasing the maximum concurrent requests to 35 or even 30 in the first step. However, I wouldn't recommend going straight to 20 or even lower. Because in the case that your services scale based on the maximum concurrent requests, which would be common, going down to 20 would result in doubling the number of instances and thus increasing your costs by 100%. Of course, your memory usage will also reduce quite a lot. But keep in mind that each instance needs at least a bit of memory to run the server and the underlying operating system, so the memory usage won't be reduced by 50% even if you double the instances.
Summary
You saw that there are quite some properties to configure the scaling behavior of your App Engine, even though not every metric, i.e., memory usage, can be used as a threshold for scaling.
CPU inexpensive requests are best scaled using the target_throughput_utilization and max_concurrent_requests properties. It doesn't matter if the requests are short or long-running, as long as it doesn't eat away the available CPU.
Scaling using the target_cpu_utilization property can work, but it depends on the actual underlying work the code has to do. As a general rule of thumb, staying with the default value of 0.6 or going with 0.7 is an excellent choice for not overloading the service and decreasing its performance.
Allowing a high number of concurrent requests on a CPU-intensive application is often a bad idea and might lead to failed requests and very long response times in many cases. Reducing the number of maximum concurrent requests is one approach to reduce load and improve performance if performance decreases.
Besides "killing it with hardware" and internal code optimizations, reducing the maximum concurrent requests for memory-intensive applications is the best way to prevent out-of-memory errors.
Do you want to get in touch?
If you want to contact me, please hit me up on LinkedIn.
Also, feel free to check out my book recommendation 📚.