
Understanding Analysis of Variance (ANOVA) with Examples in R
Statistics with R in 3 minutes

Introduction
Analysis of Variance, or ANOVA, is a statistical technique used to analyze the differences among group means in a sample. It helps us determine whether there are statistically significant differences between the means of three or more independent (unrelated) groups. ANOVA is a powerful tool widely used in various fields, including biology, economics, and social sciences, to compare multiple groups and make informed decisions. In this article, we will delve into the basics of ANOVA and provide examples in the R programming language.
The Basics of ANOVA
ANOVA works by comparing two types of variation:
- Variation between groups: This is the variation in the means of each group. If this variation is significantly larger than expected by chance, it suggests that there are differences between the groups.
- Variation within groups: This is the variation within each group. It represents the random variability or noise within each group.
The idea behind ANOVA is to compare these two types of variation and determine whether the variation between groups is statistically significant. If it is, we conclude that there are significant differences between at least two groups.
There are different types of ANOVA, including:
- One-Way ANOVA: Compares means across more than two independent groups.
- Two-Way ANOVA: Compares means across two independent categorical variables.
Performing One-Way ANOVA in R
Let's walk through a simple example of a one-way ANOVA using R. Suppose we have three different teaching methods, and we want to determine if there is a significant difference in test scores between these methods. We have collected data from three groups of students.
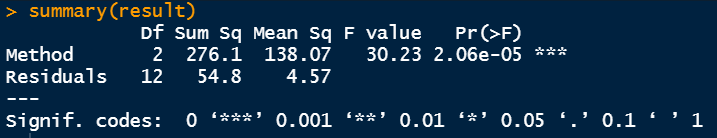
In this example, we first create sample data for each teaching method and then combine them into a single dataframe. We use the aov function to perform the one-way ANOVA, specifying the formula Score ~ Method to compare the test scores between different teaching methods. The summary function provides a summary of the ANOVA results.
The output will include:
- The F-statistic and p-value, where a small p-value (< 0.05) indicates that there are significant differences between at least two groups.
- The degrees of freedom for both between-groups and within-groups variations.
- The mean squares for both between-groups and within-groups variations.
- The residual standard error, which measures the variation within each group.
- The number of observations.
Interpreting the Results
When interpreting the results of an ANOVA, focus on the p-value:
- If the p-value is less than your chosen significance level (commonly 0.05), you can reject the null hypothesis. This suggests that at least one group is different from the others.
- If the p-value is greater than your chosen significance level, you fail to reject the null hypothesis, indicating that there is no significant difference between the groups.
In our example, if the p-value is less than 0.05, you would conclude that there are significant differences in test scores between the teaching methods.
Conclusion
ANOVA is a powerful statistical tool for comparing means across multiple groups, and it helps us determine whether the differences observed are statistically significant or due to random chance. In R, performing ANOVA is straightforward using the aov function, and interpreting the results involves examining the p-value. ANOVA is a valuable tool for researchers and analysts in various fields to make informed decisions based on group comparisons.
Remember that ANOVA assumptions, such as normality and homogeneity of variances, should be checked before drawing conclusions from the results. Additionally, post-hoc tests may be required to identify which specific group(s) differ from others when you reject the null hypothesis in a one-way ANOVA.
Thanks for reading.