
Uncovering all Data Science Interview Questions asked to me — Part 1

It’s been about 15 months since I published my last article in Towards Data Science. A lot has happened during this period including a part-time job, conversion to a full-time Data Scientist job, and finally switching to a new company in a new state kept me away from contributing to society. Nevertheless, I am back with a new article containing a consolidated overview of all the Data Science questions that have been asked to me from all the companies that I interviewed for. The companies include Oracle, C3.ai, Experian, Zest AI, Credit Suisse, Visa, and CVS Health among many.
In this article, you can find questions in the following categories:
- ML Case Study — Part 1
- ML Theory questions — Part 1
- Statistics — Part 2
- Programming — Python & SQL — Part 2
I hope this article will help you in preparing for your future interviews. Let’s get started with the fun part!
A) ML Case Study
In such case studies, asking the right questions is very important as it shows the interviewer that you are able to think in the right direction and you have got those critical thinking skills to approach any problem.
I’ve been asked a couple of case study questions in Oracle (Utilities Division) and C3.AI:
1) How would you determine houses that have electric vehicles from hourly electricity consumption data?
The answer to this question is subjective. However, according to me, we can apply various unsupervised ML techniques namely PCA, Autoencoder, or Clustering to determine the outliers with higher electricity consumption than their neighborhood houses. It may also be helpful to include all features would you create. To name a few, you may create aggregate consumption features to track min, max, and average electricity consumption in the past 1, 3, 7, 15 days, average consumption relative to the neighborhood houses within the same zip code, etc.
2) How would you predict an out-of-stock inventory list?
1. It is important to ask the market location for which the inventory is there as that would help in finding out what is the size of the market, how the demographics of the market affect the stock.
2. Asking for the past year’s demand data would also be very helpful as it would show us the various seasonalities, patterns, holiday demands, etc. necessary for modeling.
3. For feature engineering, you can introduce lags, one-hot encoded variables to account for any seasonality.
B) ML Theory Questions
1) List different types of Regression & Classification metrics.
Ans. Regression Metrics — Mean Squared Error, Root mean squared error, mean absolute error.
Classification Metrics — Accuracy, Precision, Recall, F1 Score, AUC, ROC.
2) What are the pros and cons of Mean squared error?
Ans. Cons:
1. Affected by outliers
2. Loses interpretability if the values are high
3. Doesn’t tell you the direction of the error as it is always positive
Pros:
1. Very easy to implement
2. Easy to numerically optimize
3) Can you use Mean Absolute Error (MAE) as your loss function?
Ans. Since MAE is not differentiable, it cannot be used as a loss function.
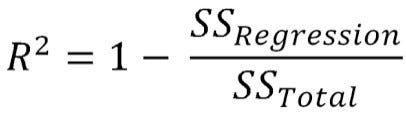
4) Can R-squared ever be negative? If yes, why. Write its formula.
Ans. Yes, R-squared can be negative. It means that your predictions are less accurate than the average value of the data over time.
Formula:
5) How do you perform cross-validation in time series data?
Ans. The following link provides a great explanation to Time series CV
https://otexts.com/fpp3/tscv.html
6) Differentiate between Bagging and Boosting? (Asked in almost all the interviews)
Ans. Bagging is short for Bootstrap Aggregation. It is a meta-algorithm where a random sample of data in a training set is selected with replacement to build ‘m’ models. In the end, the result from ‘m’ models is averaged in case of regression or voted in classification.
Boosting is another meta-algorithm that helps in boosting the accuracy of a single learner. This is done by training a series of weak learners to grow into a strong learner while learning from the errors of each subsequent weak learner.
7) What is vanishing gradient?
Ans. Vanishing gradient is a popular problem in artificial neural networks where a large change in the input of certain activation functions like sigmoid would result in a very small change in the output. As more and more layers are added to a network, the gradient of the loss function approaches zero, making the network harder to train.
8) How do Support vector machines work?
Ans. In SVM, the objective is to find an optimal hyperplane that maximizes the minimum distance between the plane and the nearest data points. This ensures that the selected hyperplane is able to successfully segregate all the data points into the respective classes.
More can be found at: https://www.analyticsvidhya.com/blog/2021/03/beginners-guide-to-support-vector-machine-svm/
9) What are the assumptions of linear regression?
Ans. There are mainly four assumptions of linear regression:
1. Linear relationship — There is a linear relationship between the independent and dependent variables
2. Normality — It assumes that all variables follow multivariate normality
3. Multicollinearity — The independent variables are not correlated with each other
4. Homoscedasticity — It assumes that the error terms have constant variance across all the values of the independent variables
10) How would you tackle overfitting in Random Forest?
Ans. Random Forest trains on a series of uncorrelated deeply grown trees which is important to understand how it could overfit. There are some major hyperparameters that you can play with:
N_estimators — As each tree is deep, you need to make sure the number of trees is not very high. Personally, I like to keep the number around 100–200.
Max_depth — Depth is important in all the decision trees which shouldn’t be kept very high even in Random Forest. Playing with max_depth using grid-search would help.
Max_features — As each tree is uncorrelated through the use of a random set of features, one should not be using all the features for training each tree as it defeats the purpose of Random Forest, and it may start to overfit. An optimal number defined in textbooks is sqrt(# of features).
Apart from the above, you can play with other hyperparameters such as min_samples_split, min_samples_leaf, etc.
11) How would you tackle overfitting in Neural Networks?
Ans. There are many ways to tackle overfitting in Neural Networks:
1. Simplifying the model — Reducing the number of nodes, hidden layers and making it less complex should be your first intuition
2. Regularization — Ridge, Lasso, and elastic net are some of the common regularization techniques to penalize the larger coefficients of the variables
3. Early Stopping — While training neural networks, a point comes when your test error starts increasing after decreasing for a number of iterations where we can stop training the model. As that point essentially indicates the beginning of overfitting
12) Define learning rate in gradient boosting.
Ans. Gradient boosted trees trains on a series of weak learners which means each tree has control over the overall result. The learning rate becomes a critical component here as it controls the amount of change that each tree makes on the result. Higher the learning rate higher will be the training speed and vice versa.
13) What is the relationship between the learning rate & the number of estimators?
Ans. They are inversely proportional to each other as if the learning rate is very low then we need a higher number of estimators to reach the final result and vice versa.
14) What are the different feature selection techniques?
Ans. Filter methods — Filter methods use statistical measures to evaluate the relationship (correlation) of two distributions and measure the correlation between the distribution of each of the classes of each feature and the dependent variable. The features that are chosen are the ones with the highest correlation with the dependent variable. For eg. Kolmogorov-Smirnov test.
Wrapper Methods — Wrapper methods utilize statistical models to evaluate the performance of each feature (or a subset of features) based on a performance metric (accuracy, AUC, f1 score, etc.). A common wrapper method is recursive feature elimination, in which a model recursively uses smaller and smaller sets of features until a desired number of features is reached.
Embedded Methods — Embedded methods perform feature elimination as the model is built. A common embedded method for feature selection is regularization, in which a norm is included in the loss function of a statistical model to penalize the number of features used.
15) How to determine your model is overfitting?
Ans. You can determine overfitting by plotting the learning curves which is a plot between the model performance on the train and test data. If the gap between the train and test curve increases with higher complexity in the model then it would indicate overfitting.
16) What is the effect of multi-collinearity on feature importances of XGBoost?
Ans. Multi-collinearity has a huge effect on feature importances as if two variables are highly correlated with each other then one variable compensates the absence of the other in the feature importance scores. Due to this, the feature importance score decreases for what could be a very important feature and you may result in dropping it.
17) What is the effect of multi-collinearity on model performances and model interpretation?
Ans. Multi-collinearity makes it harder to interpret your coefficients as they become very sensitive to small changes in the model.
18) What is the effect of a higher number of features than the number of rows?
Ans. To answer this, you can give an example like if you have only 2 columns and one data point then there can be infinitely many lines that can be the solution to that case. In other words, there won’t be a unique solution to the problem. Hence, it is important to have a higher number of rows than the columns. However, one can use techniques like ridge and lasso to tackle such cases.
19) What is the difference between Ridge and Lasso regression?
Ans. In Ridge, the penalty term is the sum of squares of coefficients whereas, in Lasso, it is the sum of absolute values of coefficients.
20) Explain overfitting to a non-technical audience.
Ans. Let’s assume you have a maths exam tomorrow for which you have practiced all book problems and have somehow memorized most of the solutions to the questions. However, during the exam, the questions asked were a little different from the ones that you memorized, and you couldn’t score well. This is what essentially happens in overfitting where the model learns the training data so well that it can’t perform well on the test data which it hasn’t seen ever.
If you have reached this point, then thank you so much for reading my article. I’ll be back with Part 2 of this article answering statistics questions and programming questions. Stay tuned!
Thank you!
If you like my work, please follow me on Medium for reading more articles in near future.
- Read my other articles on Top 10 SQL problems, Feature Engineering & Automating basic data analysis.
- Would love to connect with you on LinkedIn.