
Ultimate Observability Guide: Prometheus and Grafana Integration for Spring Boot Applications
Monitoring plays a crucial role in ensuring the health and optimal performance of Spring Boot applications. It provides insights into the application’s behavior, identifies potential issues, and helps maintain high availability. In this article series on Spring observability, we will explore the importance of monitoring and how it can be achieved using Prometheus and Grafana. By leveraging these tools, developers gain visual monitoring capabilities, allowing them to track key metrics, detect anomalies, and make data-driven decisions to improve the performance and reliability of their Spring Boot applications. Join us on this journey to discover the power of observability in Spring applications.

In previous article we have discussed about PerformanceMonitorInterceptor for monitoring and boosting performance. Here is link to article.
Let’s jump start with system architecture and short introduction about Prometheus and Grafana monitoring tools.

What is Prometheus and Grafana?
Prometheus and Grafana are powerful tools that can greatly enhance your ability to monitor and understand the performance of your Spring Boot applications. Prometheus acts as a data collection and storage system, gathering metrics and data from your application. It allows you to track important metrics like response times, error rates, and resource utilization. Grafana, on the other hand, provides a visually appealing and user-friendly interface for analyzing and visualizing this data. With Grafana, you can create interactive dashboards, charts, and graphs that make it easier to spot trends, identify issues, and gain valuable insights into the health and performance of your Spring Boot applications. Together, Prometheus and Grafana offer a seamless monitoring solution that can help you optimize your application and deliver a better user experience.
How to enable monitoring in SpringBoot application
The working code of this article can be found in git repo here
Lets create simple application using spring starters with spring web and micrometer dependencies. This project provides a simple example of a Spring Boot application with monitoring capabilities using Prometheus and Spring Actuator. The application includes a REST controller (EmployeeController.java) that exposes a GET endpoint (/employee) to retrieve the name of an employee based on the provided ID. The application also includes a service class (EmployeeService.java) that retrieves the employee name from a static map. Maven’s pom.xml will have following dependencies to enable monitoring
<dependencies>
        <dependency>
            <groupId>org.springframework.boot</groupId>
            <artifactId>spring-boot-starter-actuator</artifactId>
        </dependency>
        <dependency>
            <groupId>org.springframework.boot</groupId>
            <artifactId>spring-boot-starter-web</artifactId>
        </dependency>

        <dependency>
            <groupId>io.micrometer</groupId>
            <artifactId>micrometer-registry-prometheus</artifactId>
            <scope>runtime</scope>
        </dependency>
</dependencies>
Next, we need to expose an actuator endpoint through which Prometheus will collect metrics data in the format that Prometheus understands,
server.port = 8081
management.server.port = 8080
management.server.address= localhost


management.endpoints.web.exposure.include=prometheus
management.endpoint.health.show-details=always
- `server.port = 8081`: This property specifies the port number on which the Spring Boot application will run.
- `management.server.port = 8080`: This property sets the management port for Spring Boot Actuator endpoints. Actuator endpoints provide useful information about the application’s health, metrics, and other management-related details.
- `management.server.address = localhost`: This property defines the network address on which the Actuator endpoints will be exposed.
- `management.endpoints.web.exposure.include = prometheus`: This property configures the Actuator to expose the Prometheus endpoint.
- `/actuator/prometheus` endpoint, which can be scraped by Prometheus for monitoring purposes.
- `management.endpoint.health.show-details = always`: This property determines the level of detail to be shown in the health endpoint response.
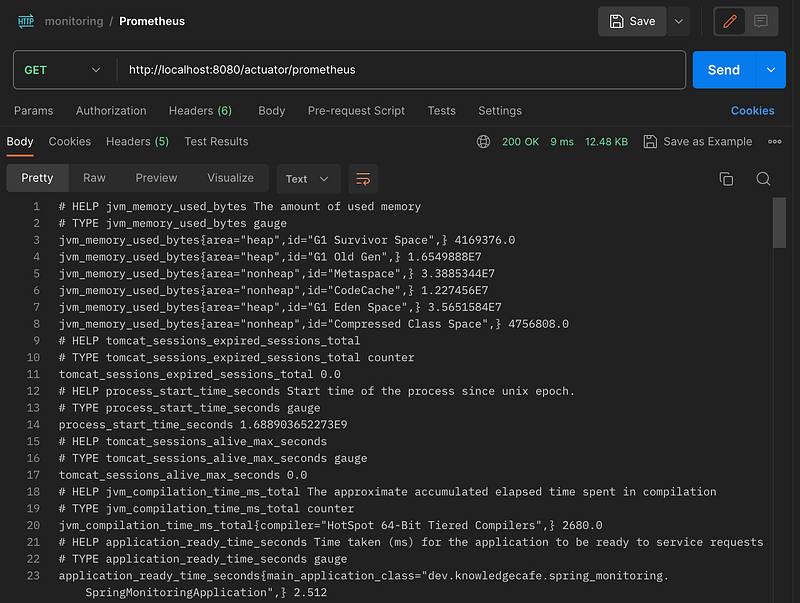
Lets start the application and hit prometheus actuator endpoint (http://localhost:8080/actuator/prometheus) using postman or your browser, you can see information like below,
How to Configure Prometheus
You have two options for installing Prometheus: either as a standalone instance or using a Docker image. You can find step-by-step instructions for both installation methods in the official documentation(link). In our case, we will focus on configuring Prometheus to collect and monitor the metrics from our Spring Boot application
Before we begin using Prometheus, we have to set it up to collect data from our locally running Spring Boot application. For simplicity, we’ll run Prometheus and Grafana on our local machine. To do this, we need to configure a job that will fetch data from a specific endpoint. We can define this job in the prometheus.yaml configuration file as shown below:
scrape_configs:
  - job_name: 'Spring Boot Application'
    metrics_path: '/actuator/prometheus'
    scrape_interval: 5s
    static_configs:
      - targets: ['localhost:8080']
        labels:
          application: 'Employee Application'
In this configuration, we define a job named ‘Spring Boot Application’ that scrapes data from the /actuator/prometheus endpoint every 5 seconds. The targets section specifies that the target endpoint to scrape data from is localhost:8080, which is where our Spring Boot application is running. We also add a label called 'application' and set it to 'Employee Application' to provide additional information about our application.
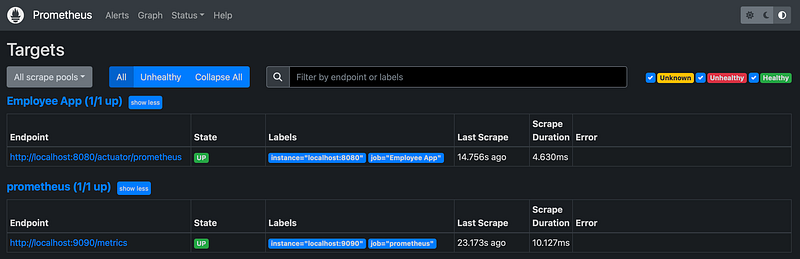
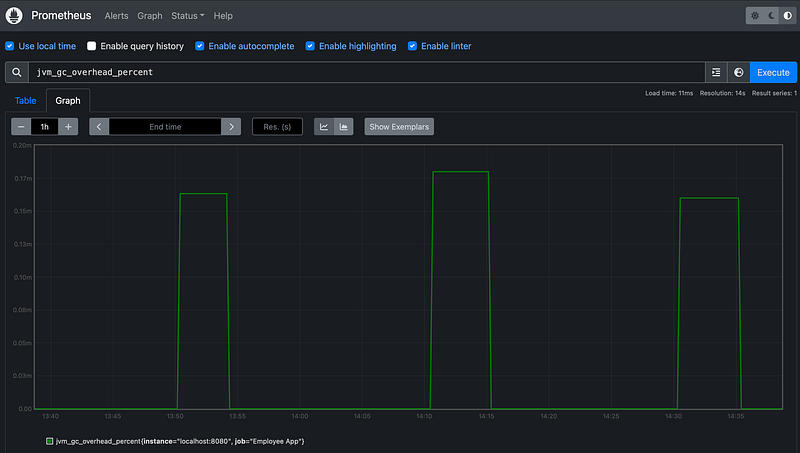
Lets start the prometheus application and hit prometheus end point at default url http://localhost:9090. Under Targets, we can see prometheus is monitoring itself and our spring application. We can see some graphs here but it will not be very useful as prometheus is metrics capturing and storing tool.
How to Configure Grafana
You have two options for installing Grafana: either as a standalone instance or using a Docker image. You can find step-by-step instructions for both installation methods in the official documentation, Link. In our case, we will focus on configuring Grafana with the default settings. We will set up Prometheus as the source of metrics for Grafana, allowing us to visualize and analyze the metrics data in a user-friendly manner.
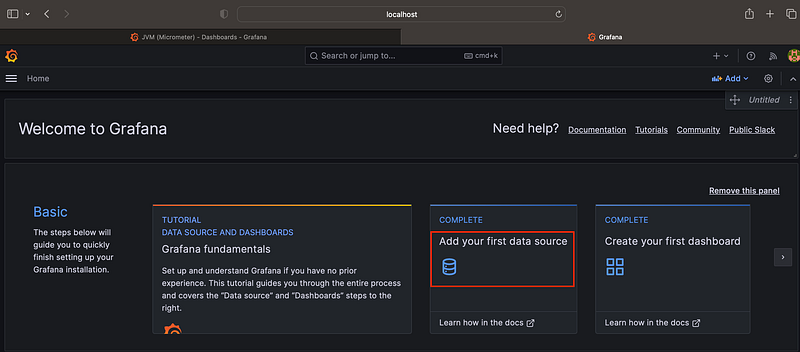
Once we start Grafana, we will see login screen (default user name and password is admin) after login we can see option to import datasource like below,
Once you provide the details about your running Prometheus instance, get ready to be amazed! You’ll be able to view your metrics in a visually stunning and captivating way. Grafana empowers you to create your own personalized dashboards, or if you prefer, you can import ready-made dashboards from Grafana Labs. Get ready to explore your metrics like never before and uncover valuable insights with Grafana’s powerful visualization capabilities!
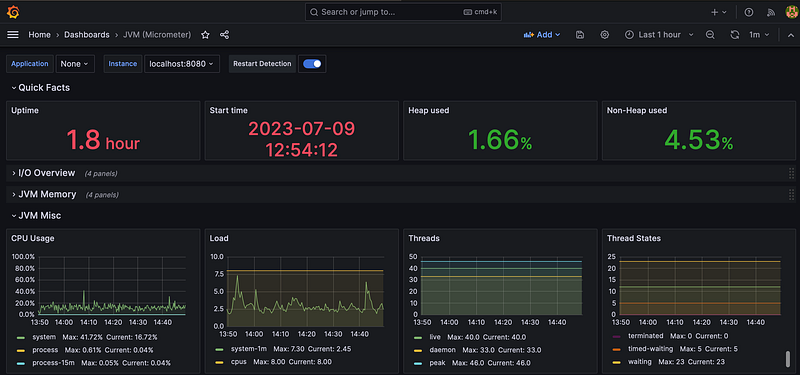
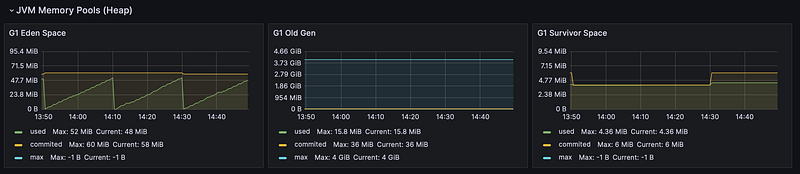
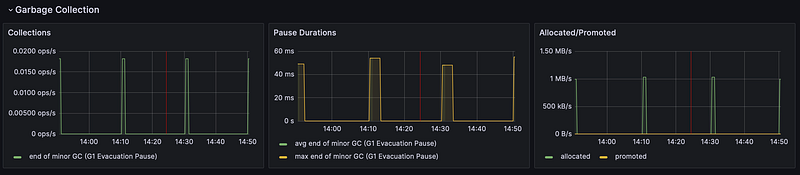
Here I have imported Spring boot dashboard and I can see all default metrics exposed by my spring application.
Summary
🎉 Congratulations on gaining a new skill in Spring Boot monitoring with Prometheus and Grafana! In this blog, we covered the importance of monitoring in Spring Boot applications and how Prometheus and Grafana can take your monitoring game to the next level. We explored how to configure Prometheus to gather metrics from your application, and we delved into the exciting world of visualizing and analyzing those metrics using Grafana’s captivating dashboards.
Now that you’re equipped with these powerful tools, you have the ability to unlock deep insights into the performance and health of your applications. Stay up-to-date with the latest insights and tutorials by following me on LinkedIn and Twitter.
Don’t forget to subscribe to my blog for more exciting content on Spring observability and other amazing topics. Get ready to revolutionize your monitoring skills and take your applications to new heights! 🚀


