
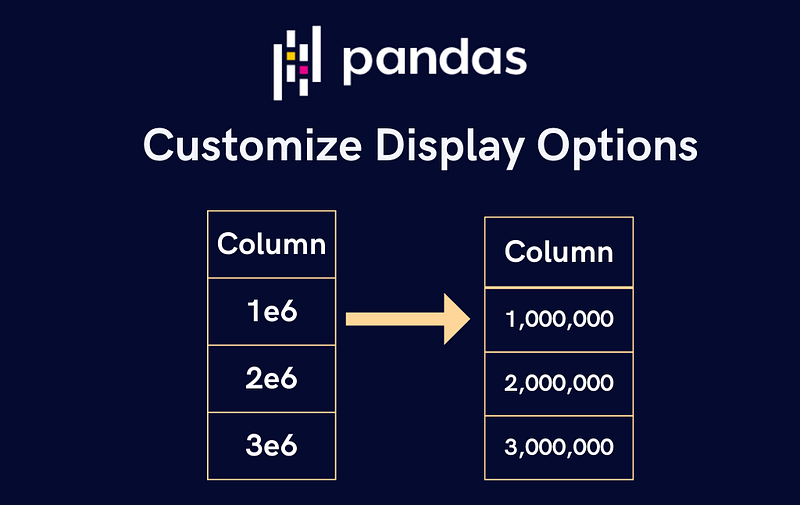
Try These Pandas Display Configurations in Your Next Analysis
Make your Jupyter notebook more presentable with these useful Pandas display customizations
While analyzing data using Pandas, you might have faced the following display-related issues:
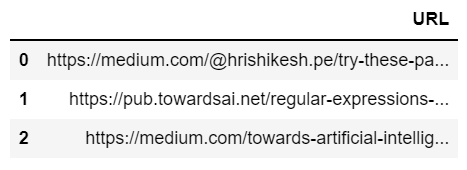
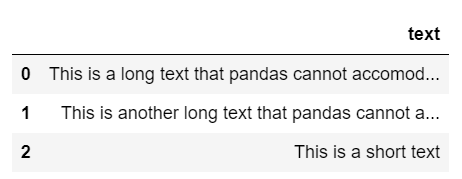
- Unable to see the entire text if they are lengthy. In the following image, URLs get shortened.
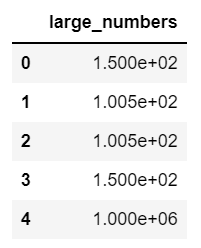
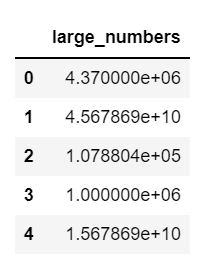
2. Pandas by default show large floating-point numbers using scientific notation, e.g. 1,000,000.5 is shown as 1.000e+06
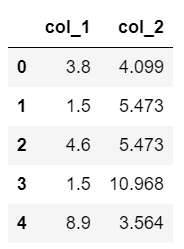
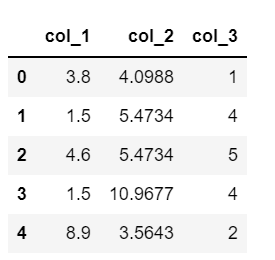
3. Inconsistent decimal place accuracy among float type columns. E.g, in the following figure, col_1 has one digit after decimal point whereas col_2 has three digits post decimal point. Though this will not affect your analysis, it might not look good while sharing your notebook with others.
In this story, I am going to cover how to solve these issues using the following common Pandas display customizations.
List of contents
- Customize how many rows to display
- Customize how many columns to display
- Customize column width
- Make decimal place accuracy consistent among float columns
- Disable the scientific notation
- Bonus!
Note: These options only change how data will be displayed. It does not affect underlying data.
- Customize how many rows to display
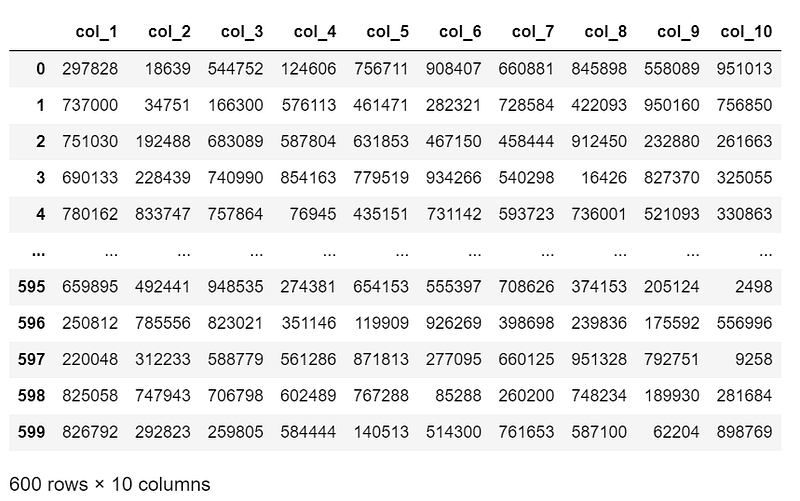
When you print a large data frame, pandas display the first 5 and last 5 rows by default as illustrated below.
However, we can change how many rows to display by setting a value for the display option display.max_rows. Let’s set it to 4.
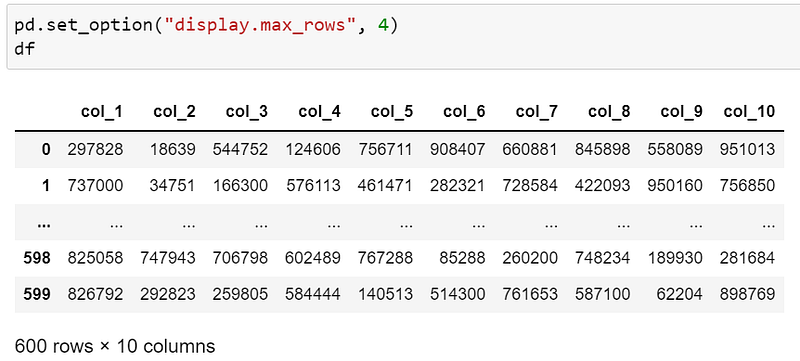
You can also reset the option using pd.reset_option("display.max_rows") to return to the default behavior.
2. Customize how many columns to display
You can customize the number of columns to show while printing the data frame by setting display.max_columns.
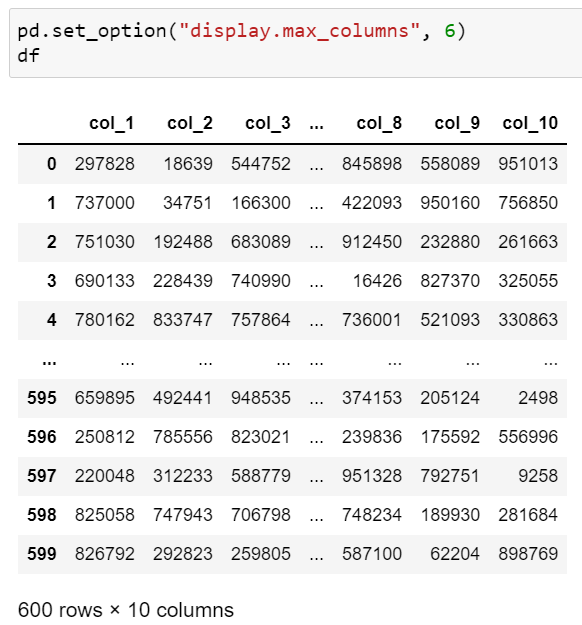
Like previous, you can also reset this option using pd.reset_option("display.max_columns") to return to the default behavior.
3. Customize column width
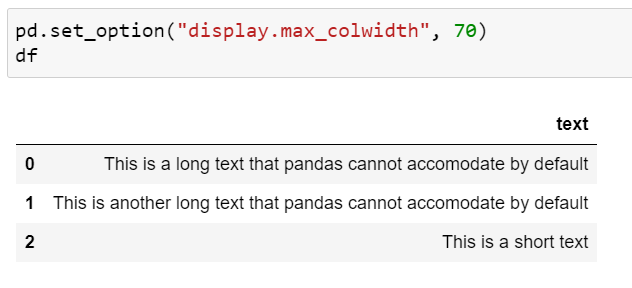
In the following image, we cannot see the full text for the first two rows as their character length exceeds 50.
However, after setting display.max_colwidth it to 70, we can see the entire text. You can choose a different number based on your data.
This option can also be reset by using pd.reset_option("display.max_colwidth") .
4. Make decimal place accuracy consistent among float columns
Currently, col_1 and col_2 have inconsistent decimal place accuracy as depicted below.
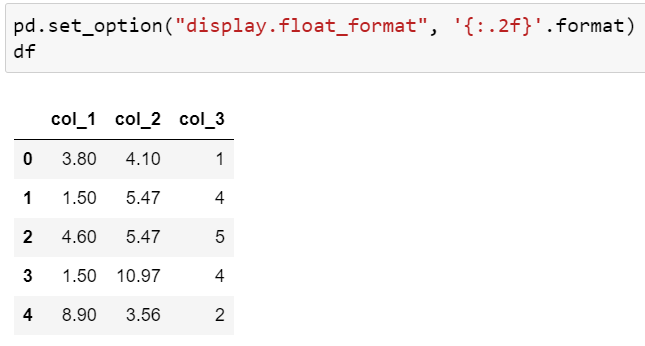
By setting display.float_format to "{:.2f}".format we can make the format consistent. As shown in the image below, the option will only affect the float columns, not the integer columns.
This option can be reset using pd.reset_option("display.float_format")
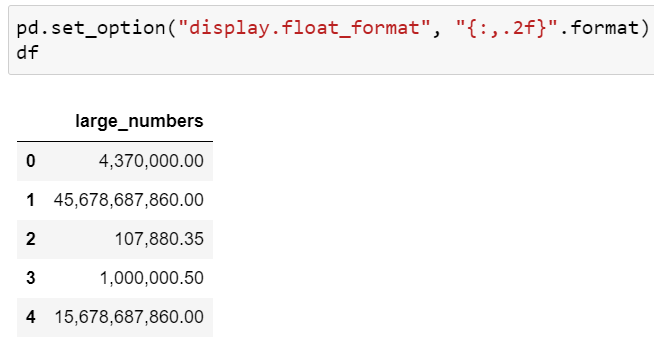
5. Disable the scientific notation
Pandas by default show large float values in the scientific notation.
By setting display.float_format to "{:,.2f}".format , we can add a separator for thousands and also set decimal place accuracy to two decimals.
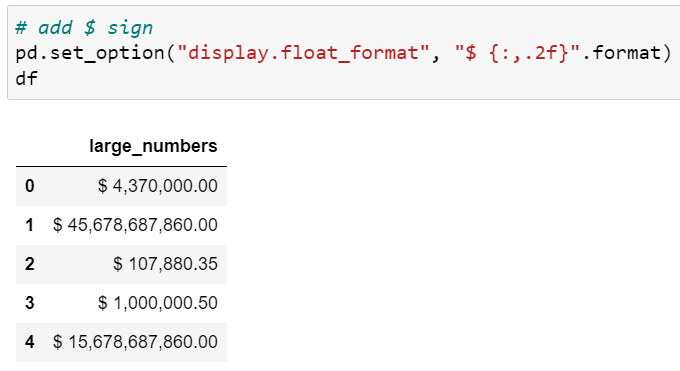
You can also add a $ sign before the numbers to show currency by setting display.float_format to "$ {:,.2f}".format.
6. Bonus
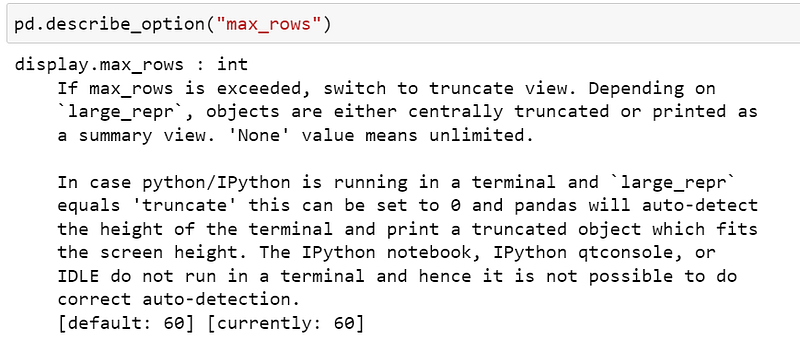
How to find all such useful display options when you are working offline? The trick is to use pd.describe_option() and you’ll get a list of all available options.
However, if you are looking for a specific option, you can type the option name as an argument in pd.describe_option() . For example, pd.describe_option("max_rows") will print the description of display.max_rows the option.
Reference Pandas Options and Settings
Before you go!
I hope you have enjoyed the story and found it useful. Follow me on Medium if you’d like more stories like this and feel free to buy me a coffee 😊.
My other stories you might enjoy…


