
Trading Bitcoin: 3 Indicators You Must Be Using
While highly volatile, Day Traders can still capitalise on smaller movements by using the correct tools

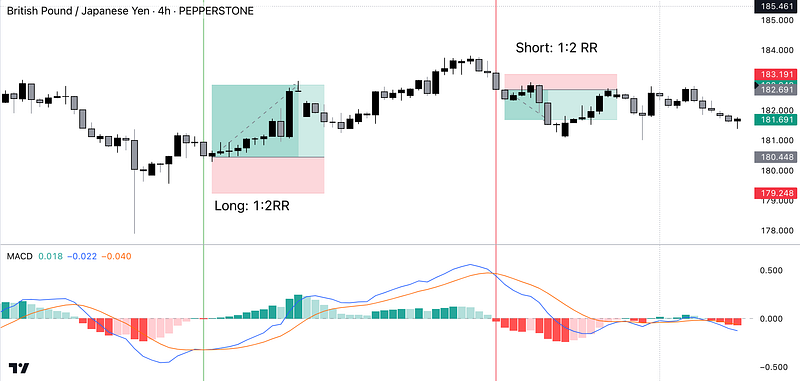
1) The MACD Indicator
The Moving Average Convergence Divergence (MACD) is an indicator that helps identify trends and potential reversals by analyzing the relationship between two moving averages of different periods. It is commonly used in technical analysis to generate trading signals.
How to Use the MACD Indicator When Trading Bitcoin
When it comes to trading Bitcoin, having a solid understanding of technical analysis and using the right indicators can greatly enhance your trading strategy. One of the most popular indicators used by traders is the Moving Average Convergence Divergence (MACD).
Interpreting MACD Signals
Crossovers
One of the primary ways to use the MACD indicator is by observing the crossovers between the MACD line and the signal line. When the MACD line crosses above the signal line, it generates a bullish signal, indicating a potential upward trend. Conversely, when the MACD line crosses below the signal line, it generates a bearish signal, suggesting a potential downward trend.
Divergence
Another way to utilize the MACD indicator is by analyzing divergence. Divergence occurs when the price of Bitcoin and the MACD indicator move in opposite directions. Bullish divergence happens when the price makes lower lows while the MACD indicator makes higher lows. This can indicate a potential trend reversal to the upside. Conversely, bearish divergence occurs when the price makes higher highs while the MACD indicator makes lower highs, suggesting a potential trend reversal to the downside.
Histogram
The MACD histogram represents the difference between the MACD line and the signal line. It provides further insights into the strength of a trend. When the histogram is above the zero line, it indicates bullish momentum, while a histogram below the zero line suggests bearish momentum. Traders often look for histogram expansions or contractions as potential signals of increasing or decreasing momentum, respectively.
Applying the MACD Indicator to Bitcoin Trading
Now that you understand the basics of the MACD indicator, let’s discuss how to apply it to Bitcoin trading. Here are a few key points to keep in mind:
- Confirm with other indicators: While the MACD indicator can be powerful on its own, it is always advisable to confirm its signals with other technical indicators or chart patterns. This can help reduce false signals and increase the accuracy of your trades.
- Consider different timeframes: The MACD indicator can be used on different timeframes, such as daily, weekly, or even intraday charts. It is essential to adjust the settings of the indicator based on your preferred timeframe and trading style.
- Combine with risk management strategies: Trading Bitcoin, like any other financial instrument, involves risk. It is crucial to implement proper risk management strategies, such as setting stop-loss orders or using proper position sizing, in conjunction with the MACD indicator.
- Practice and refine your strategy: As with any trading indicator, it takes time and practice to develop a profitable trading strategy using the MACD indicator. It is recommended to backtest your strategy using historical data or paper trade in a simulated environment before risking real capital.
The MACD indicator is a valuable tool for traders looking to capitalize on trends and potential reversals when trading Bitcoin. By understanding how to interpret MACD signals and applying the indicator to your trading strategy, you can make informed decisions and potentially improve your trading results.
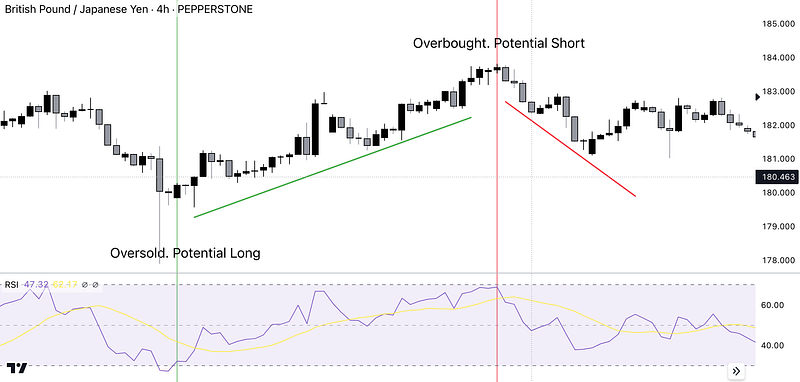
2) Relative Strength Index (RSI)
Relative Strength Index (RSI): The RSI is a momentum oscillator that measures the speed and change of price movements. It helps determine if an asset is overbought or oversold, indicating potential reversal points.
How to Use the RSI Indicator When Trading Bitcoin
When it comes to trading Bitcoin, understanding technical analysis and using the right indicators can greatly enhance your trading strategy. One popular indicator used by traders is the Relative Strength Index (RSI). In this article, we will explore how to effectively use the RSI indicator when trading Bitcoin.
What is the RSI Indicator?
The RSI indicator is a momentum oscillator that measures the speed and change of price movements. It helps identify if an asset is overbought or oversold, indicating potential reversal points. The RSI ranges from 0 to 100, with readings above 70 considered overbought and readings below 30 considered oversold.
Interpreting RSI Signals
Overbought and Oversold Levels
One common way to use the RSI indicator is by identifying overbought and oversold levels. When the RSI reading is above 70, it suggests that Bitcoin may be overbought and a price correction or reversal could occur. Conversely, when the RSI reading is below 30, it indicates that Bitcoin may be oversold and a potential price bounce or reversal could happen.
Divergence
Another way to utilize the RSI indicator is by looking for divergences between the price of Bitcoin and the RSI reading. Bullish divergence occurs when Bitcoin makes lower lows while the RSI indicator makes higher lows. This can signal a potential trend reversal to the upside. On the other hand, bearish divergence occurs when Bitcoin makes higher highs while the RSI indicator makes lower highs, suggesting a potential trend reversal to the downside.
RSI Trendline Breaks
Traders can also pay attention to trendline breaks on the RSI indicator. If the RSI breaks above a downward trendline, it could indicate a potential bullish trend reversal. Conversely, if the RSI breaks below an upward trendline, it may suggest a potential bearish trend reversal.
Applying the RSI Indicator to Bitcoin Trading
Now that you understand the basics of the RSI indicator, let’s discuss how to apply it to Bitcoin trading. Here are a few key points to keep in mind:
- Confirm with other indicators: While the RSI indicator can provide valuable insights, it is always advisable to confirm its signals with other technical indicators or chart patterns. This can help reduce false signals and increase the accuracy of your trades.
- Adjust RSI parameters: The default setting for the RSI indicator is usually 14 periods, but you can adjust it based on your preferred timeframe and trading style. Shorter timeframes may require smaller RSI periods for more sensitive readings, while longer timeframes may benefit from larger RSI periods for smoother readings.
- Combine with other analysis techniques: The RSI indicator works best when used in conjunction with other technical analysis techniques. Consider combining it with trendlines, support and resistance levels, or other indicators to strengthen your trading strategy.
- Practice risk management: Trading Bitcoin involves risk, so it is crucial to implement proper risk management strategies. This includes setting stop-loss orders, managing position sizes, and having a clear exit strategy.
Remember, the RSI indicator is not foolproof, and false signals can occur. It’s important to conduct thorough research, practice with historical data or paper trading, and seek professional advice when needed. By incorporating the RSI indicator into your trading strategy, you can potentially improve your decision-making process and trading outcomes.
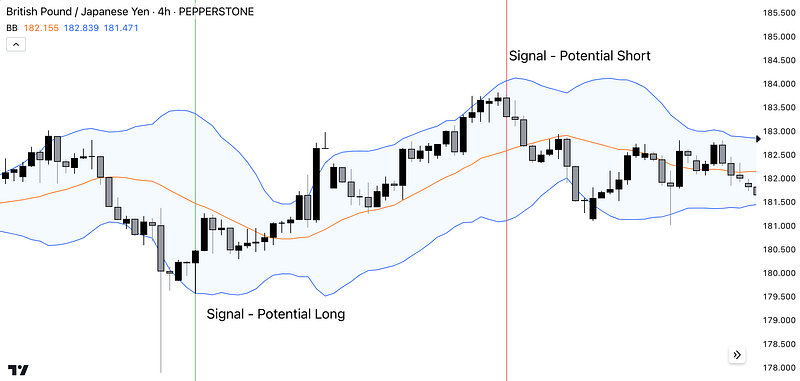
3) Bollinger Bands (BB)
Bollinger Bands (BB): Bollinger Bands consist of a moving average and two standard deviation lines above and below it. They help identify periods of high volatility and potential price breakouts.
How to Use Bollinger Bands When Trading Bitcoin
When it comes to trading Bitcoin, having a solid understanding of technical analysis and using the right indicators can greatly enhance your trading strategy. One popular indicator used by traders is Bollinger Bands. In this article, we will explore how to effectively use Bollinger Bands when trading Bitcoin.
What are Bollinger Bands?
Bollinger Bands are a technical analysis tool created by John Bollinger. They consist of a simple moving average (SMA) in the middle, with two standard deviation lines plotted above and below the SMA. The standard deviation lines dynamically expand and contract based on the volatility of the Bitcoin price.
Interpreting Bollinger Bands
Volatility and Squeeze
Bollinger Bands help identify periods of high and low volatility in the Bitcoin market. When the bands are close together, it indicates low volatility or a squeeze, suggesting that a significant price move may be imminent. Conversely, when the bands expand, it suggests high volatility, indicating potential price breakouts or breakdowns.
Support and Resistance Levels
The upper and lower Bollinger Bands can also act as support and resistance levels for the Bitcoin price. When the price touches or crosses the upper band, it may indicate overbought conditions, suggesting a potential price reversal to the downside. Similarly, when the price touches or crosses the lower band, it may indicate oversold conditions, suggesting a potential price reversal to the upside.
Price Breakouts
Bollinger Bands can also help identify price breakouts. When the Bitcoin price breaks above the upper band, it indicates a potential bullish breakout, suggesting that the price may continue to rise. On the other hand, when the price breaks below the lower band, it indicates a potential bearish breakout, suggesting that the price may continue to fall.
Applying Bollinger Bands to Bitcoin Trading
Now that you understand the basics of Bollinger Bands, let’s discuss how to apply them to Bitcoin trading. Here are a few key points to keep in mind:
- Confirm with other indicators: Bollinger Bands work best when used in conjunction with other technical indicators or chart patterns. Consider combining them with trendlines, support and resistance levels, or other indicators to strengthen your trading strategy and confirm signals.
- Consider timeframes: Bollinger Bands can be used on different timeframes, such as daily, weekly, or even intraday charts. It is essential to adjust the settings of the bands based on your preferred timeframe and trading style. Shorter timeframes may require smaller standard deviation values for more sensitive readings, while longer timeframes may benefit from larger standard deviation values for smoother readings.
- Use in conjunction with other analysis techniques: Bollinger Bands are most effective when used in combination with other technical analysis techniques. Consider incorporating other indicators, such as the MACD or RSI, to validate signals and increase the accuracy of your trades.
Remember, Bollinger Bands are not foolproof, and false signals can occur. It’s important to conduct thorough research, practice with historical data or paper trading, and seek professional advice when needed. By incorporating Bollinger Bands into your trading strategy, you can potentially improve your decision-making process and trading outcomes.
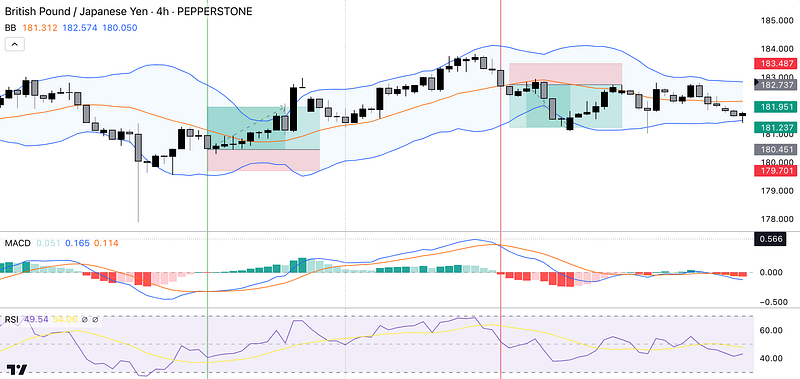
Using all three together
Ultimately, these three indicators work best when paired together. As with all other indicators. Never use them in isolation.
Bitcoin is one of the most volatile instruments to trade in the markets.
Make sure you have a stop-loss.
Thanks for taking the time to read this.