
Tracking Covid-19 from Manhattan to the Heartland
The Infection Rate Remains the Same
The news tells us all the time about the COVID-19 disaster happening in New York City. But there is more to the story. Just look at the meat-packing plants where large numbers of workers are infected. And some, too many, are dying. Dying because they went to work. This virus, Sars-Cov-2 is its formal name, is deadly and destructive even in the heartland.
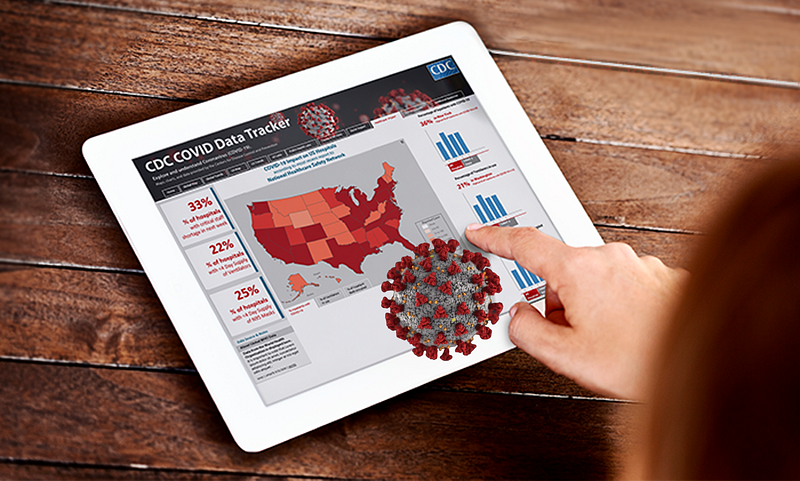
The main picture is a composite of two images from the Center for Disease Control. The data used in this article are, for the most part, from the Johns Hopkins University Coronavirus Resource Center.
I have a question. Is the rate of infection any different in the heartland? See the numbers below and decide for yourself.
First, a couple of comments. The Sars-Cov-2 virus spreads from people who do not have any symptoms. In people who become symptomatic, the virus spreads for several days before the symptoms appear. In the early days we were told that it spread when people got sick and coughed or sneezed. The droplets from those coughs and sneezes landed on some surface. A healthy person then touched that surface and the remnants of the droplet and the virus got on his/her hands. The hand touches the face, and the virus moves to the nose, mouth or even the eyes. It has gained entry to the body to do its damage. Evidence today says that model is too simplistic.
The people spreading the virus have no symptoms. They are not coughing. They are not sneezing. But they still spread the virus to people around them. Experts argue about the mechanisms for this. Some say droplets spread the virus. Others blame “micro-droplets.” Still other blame “aerosols.” Some people claim the virus is airborne like the measles. The technical details matter little. People with no symptoms are simply breathing, talking, yelling, or singing, and they spread the virus to others. We have a lot to learn about the mechanism of transmission. It is far-fetched to think that a lot of people at meat-packing plants or in nursing homes or in prisons are running around coughing and sneezing. It is more likely that they spread the virus by breathing out small particles laden with virus particles. The surrounding people inhale just enough virus to cause an infection. The experts do not know how many viral particles, or “virions,” it takes to infect someone. The details do not matter. The spread of Sars-Cov-2 has exploded across the country. What matters is this: how do we slow the spread of this deadly virus.
My thesis is simple: congestion of people, no matter where it occurs, enables and amplifies the spread of the Sars-Cov-2 virus. That virus infects people, some of whom become symptomatic. Some do not show any symptoms. Both groups can spread the virus to others.
The numbers from the heartland, and from the congested metropolis of New York City, tell us the true perils of congestion. Yes, congestion occurs in the heartland. And, yes, it is just as deadly in the heartland as it is in the city.
How do we stop congestion? It is simple. Increase “PHYSICAL DISTANCING!” The medical experts call it “social distancing.” That term is misleading. It ignores the physical closeness that occurs for other reasons such as work.
Social gatherings are spreading the Sars-Cov-2 virus. That is killing some people. It is physical congestion is the actual culprit. Activities in areas of congestion are the real cause of the rampant spread of the virus. Let the numbers tell the story.
The Data Source
The Center for Systems Science and Engineering (CSSE) at Johns Hopkins University has tabulated the numbers that tell the story.
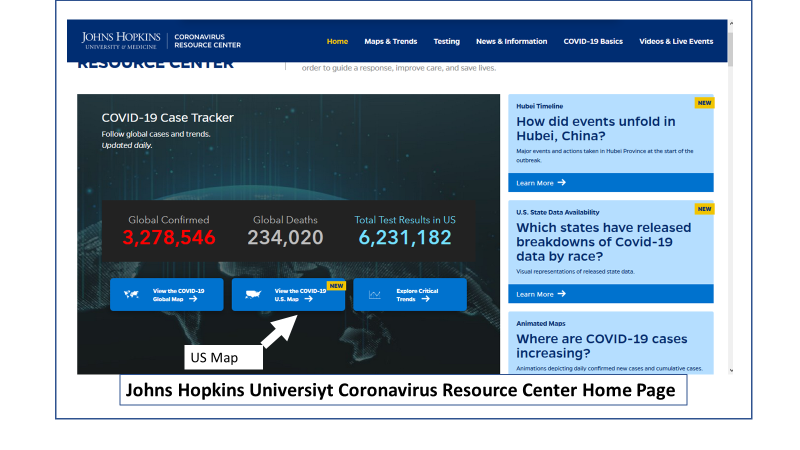
The link is here: https://coronavirus.jhu.edu/
Select the map for the “Confirmed by Population.” This map will show the infection rate (infections per 100,000 population), the total infections and the deaths for each county.
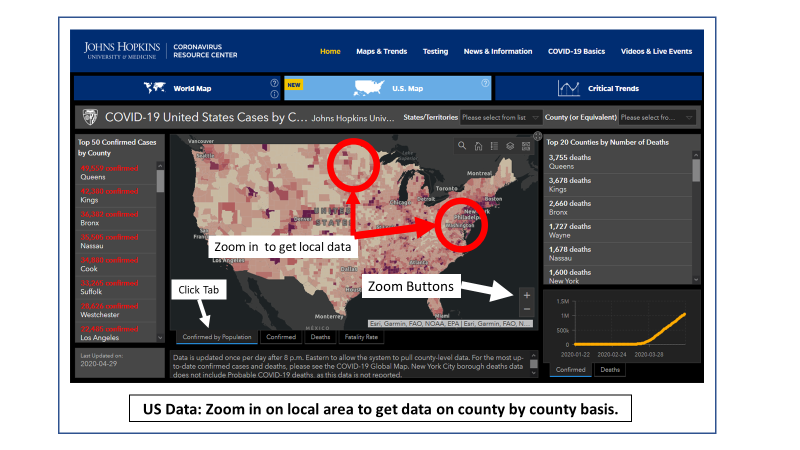
Select a County
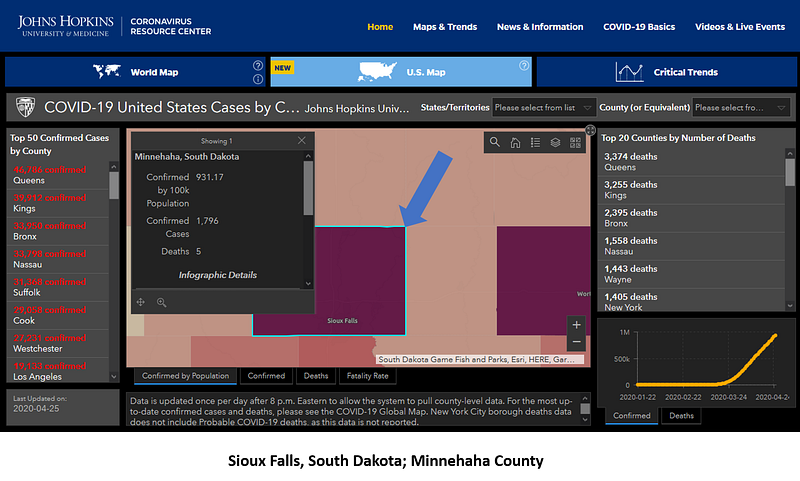
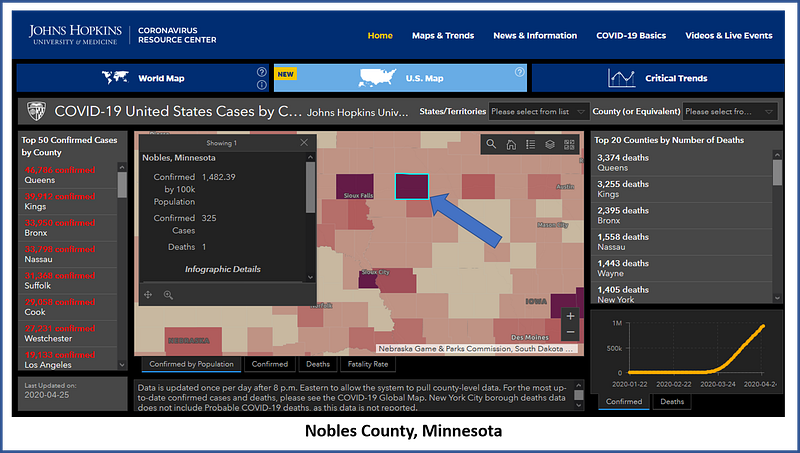
For example, zoom in to highlight Minnehaha County, home of Sioux Falls, South Dakota. Once the county is selected, a box pops up in the upper left corner of the map. This box shows the information specific for the selected county. When you select a county, it is highlighted by a light blue line around the borders of the county.
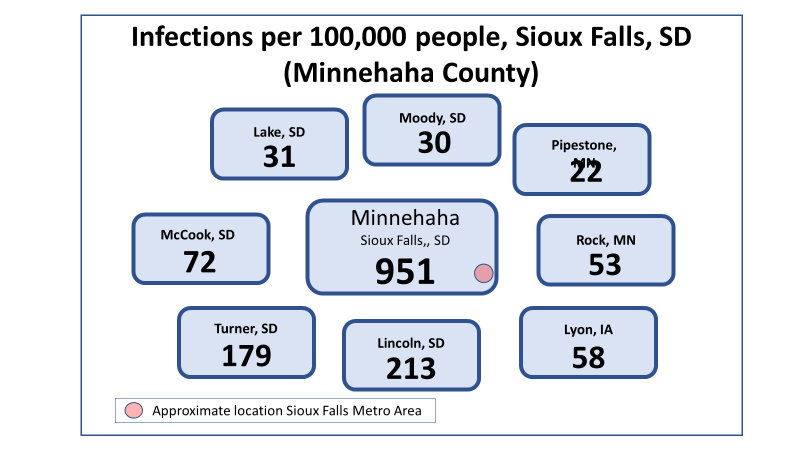
Here is Minnehaha County, which is home for Sioux Falls, South Dakota.
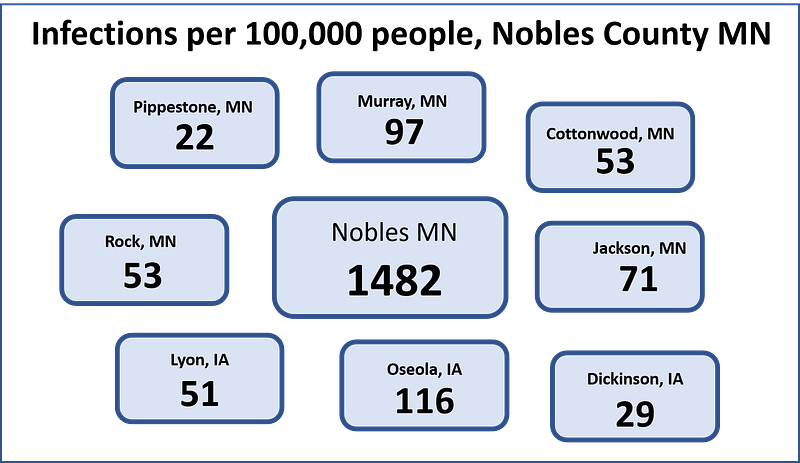
I have applied the same techniques for Nobles County, which is in Minnesota. It also shows an increase in COVID-19 infections.
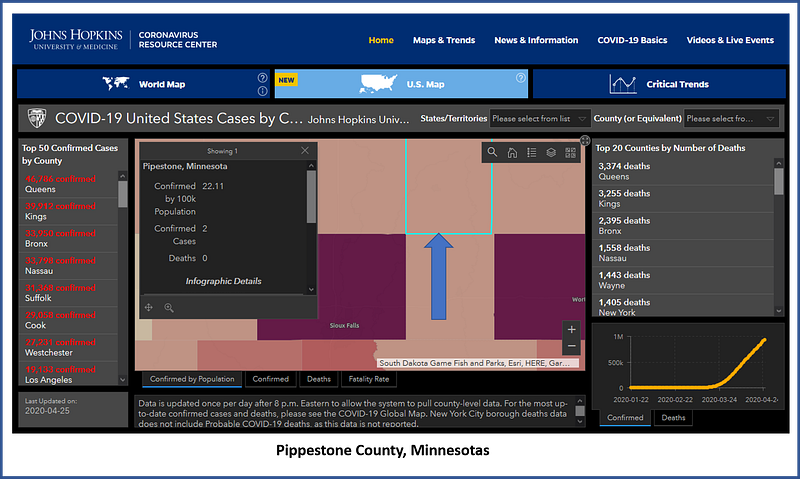
I have repeated this process to gather data on the two target counties and each of the surrounding counties. The surrounding counties are mostly agricultural and have much lower population as a whole. The population in the entire county is on the order of 6000.These counties have wide open spaces, where physical distancing occurs automatically.
Here is a map for Pippestone County, Minnesota. It is an example of the process.
A Simplified Graphical Image
Once this process is completed, a diagram of the Infection rates of the main and surrounding counties is drawn. The results show a dramatic impact of physical congestion versus physical distancing. Each box represents a specific county. The boxes are arranged to represent the relative position, compared to the main county. The number in the box gives the infection rate per 100,000 people for that county. Workers at the Smithfield Meat Plant, and people they infected, account for the high rate of infection in Minnehaha County.
Look at the data for Nobles County, Minnesota, and the surrounding rural counties. Nobles County has a prison and a nursing home. Both of these institutions have congested populations. Prisons and nursing homes are known to be sources of widespread COVID-19 infections. The infection rate in Nobles County is far greater than the rate in the surrounding counties. As we will see later, it is also greater than the infection rate in Manhattan.
In both counties, the increase in rate of infection occurred as a result of congestion of people in institutions.
The Data Speak! What Do WE Do?
The data are unmistakable! Where there is physical congestion, the rate of COVID-19 increases. COVID-19 infections cause deaths that increase in parallel to the rate of infection. By contrast, where there is physical separation, as occurs in the very rural counties, the RATE of infection decreases.
The story of the Smithfield Meat Packing Plant is told in numerous other locations across the country. Where people are packed in close proximity, the virus goes viral! People are infected and people die! The slogans tell us to practice “social distancing.” What we really need is PHYSICAL distancing. In more accurate terms: We need to avoid physical congestion at any cost. We need to do this until there is an effective treatment to arrest the destruction of the lungs that Sars-Cov-2 causes. It appears that the antiviral drug Remdesivir offers some hope. However, it is not a cure. First, it stops the virus from replicating. It does nothing to repair the tissues that have already been damaged. Furthermore, it must be given by intravenous infusion. It is also not available in large enough quantities to treat everyone who is sick with COVID-19. Remdesivir is reserved for the people who are seriously ill.
Someday, we will have a vaccine that is readily available, affordable and effective. When enough people are vaccinated, we can return to a semblance of normal activity. However, at the earliest, a vaccine will not be available until late summer of this year. It may not be available until 2021.
In the meantime, AVOID PHYSICAL CONGESTION!!
New York for Comparison
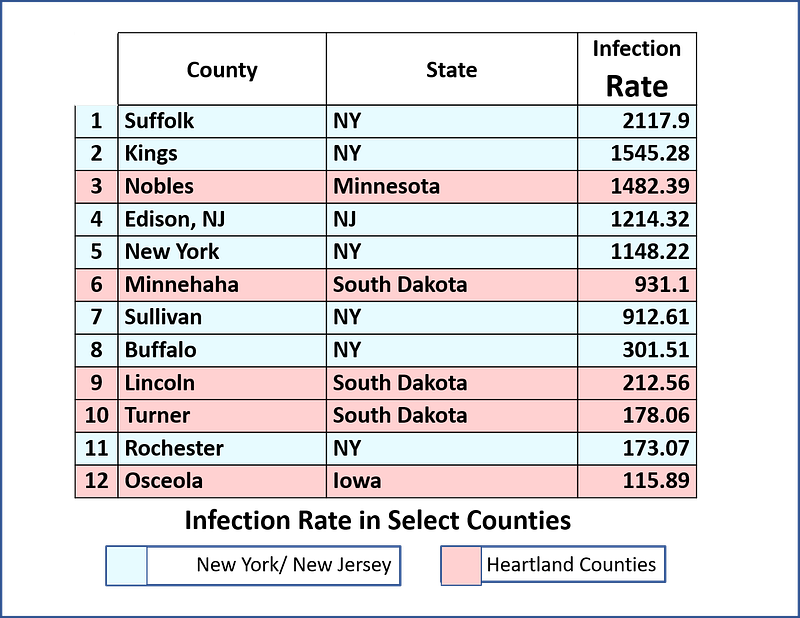
The same process was done for select counties in New York State. These included counties in New York City itself, as well as counties in the upstate area. A table of data shows the comparison. In the table, the pink rows show the infection rate for counties from the heartland. The pale blue rows show the counties for New York and one county in New Jersey. The colors tell the story:
1. Where physical congestion occurs, the risk of infection goes up.
2. The infection rates in the congested areas of the heartland do not differ from the infection rates in New York City.
3. The infection rates in the less congested areas of New York State are about the same as the rates in less congested counties in the heartland.
4. Infection rates in sparsely populated rural counties are very low. These areas have physical distancing by their very nature.
Compare New York
I have gone through the same process for some counties in New York State. I have prepared a table that shows the infection rate in select counties in New York and in the heartland. The table includes counties where the infection rate is greater than 100 infections per 100,000 people. In the table, counties from the heartland are identified by pink rows. Counties from New York and New Jersey are identified by pale blue colors.
The data are striking. The infection rate in Nobles County, Minnesota, is HIGHER than the infection rate in New York County (Manhattan). The virus has the same infection rate in populated areas of the heartland as it does in the densely populated metropolis of New York.
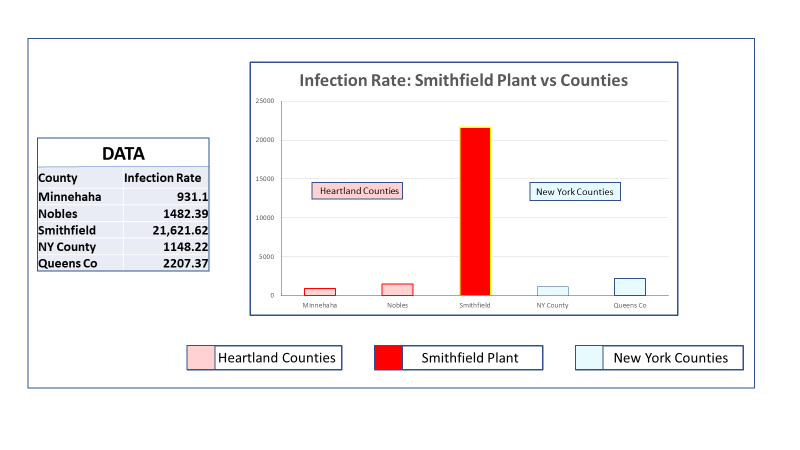
Meat Packing Plant Infection Rate
The Smithfield Meatpacking Plant employs about 3700 people. As of 4/26/2020, about 700 cases involve or are linked to employees at the plant had infections with coronavirus. That means that the infection rate (number of infections per 100,000 people) was 10 times the rate in the closest US County. Queens County New York had an infection rate of 2207. The calculated infection rate in the Smithfield Plant was an astounding 21,621! Here is a graph comparing the Smithfield infection rate to two counties in the heartland and 2 counties in the New York City area.
Conclusion
Human congestion is a major driving force for the current COVID-19 Pandemic. We have no treatment. We have no vaccine. There is only one proven intervention: Stop Human Congestion.
You can use other names for this intervention. You can call it “Social Distancing.” Or you can call it “Physical Distancing.” Forget about the name. Distancing is necessary because of the nature of some infections. Remember, some people shed virus particles when they have an infection but have no symptoms.
It may be true that most people will recover from the virus. But we have not started to count the rate of long-term disability that scarring in the lungs will cause. And for those with high risk factors, people who fail to maintain physical distancing are playing Russian Roulette with other peoples’ lives. So don’t be selfish. Follow the rules. Save someone else’s life. I will wear my mask in public and I will maintain a distance. I do this to protect YOU. Please, be a decent person and return the favor to me and your neighbors.