
Topic Model Visualization using pyLDAvis
Creating Interactive Topic Model Visualizations

Topic Modelling is a part of Machine Learning where the automated model analyzes the text data and creates the clusters of the words from that dataset or a combination of documents. It works on finding out the topics in the text and find out the hidden patterns between words relates to those topics.
By using topic modeling we can create clusters of documents that are relevant, for example, It can be used in the recruitment industry to create clusters of jobs and job seekers that have similar skill sets. There are several ways of obtaining the topics from the model but in this article, we will talk about LDA-Latent Dirichlet Allocation.
LDA works on the matrix factorization technique in which it assumes a is a mixture of topics and it backtracks to figure what topics would have created these documents. The important part is that in this article we will create visualizations where we can analyze the clusters created by LDA.
pyLDAvis is an open-source python library that helps in analyzing and creating highly interactive visualization of the clusters created by LDA. In this article, we will see how to use LDA and pyLDAvis to create Topic Modelling Clusters visualizations.
Let’s get started…
Installing Required Libraries
This article will mainly focus on pyLDAvis for visualization, in order to install it we will use pip installation and the command given below will perform the installation.
pip install pyldavisImporting Required Libraries
In this article, we will start by creating the model by using a predefined dataset from sklearn. In order to do all these steps, we need to import all the required libraries.
from __future__ import print_function
import pyLDAvis
import pyLDAvis.sklearn
pyLDAvis.enable_notebook()
from sklearn.datasets import fetch_20newsgroups
from sklearn.feature_extraction.text import CountVectorizer, TfidfVectorizer
from sklearn.decomposition import LatentDirichletAllocationAs the main focus of this article is to create visualizations you can check this link on getting a better understanding of how to create a topic model.
Loading the Dataset
Now we will load the dataset that we have already imported. The newsgroup is a textual dataset so it will be helpful for this article and understanding the cluster formation using LDA.
newsgroups = fetch_20newsgroups(remove=('headers', 'footers', 'quotes'))
docs_raw = newsgroups.data
print(len(docs_raw))
Here we will see that the dataset contains 11314 rows of data. Next, we will apply CountVectorizer, TFID, etc., and create the model which we will visualize.
Preprocessing the Data
tf_vectorizer = CountVectorizer(strip_accents = 'unicode',
                                stop_words = 'english',
                                lowercase = True,
                                token_pattern = r'\b[a-zA-Z]{3,}\b',
                                max_df = 0.5,
                                min_df = 10)
dtm_tf = tf_vectorizer.fit_transform(docs_raw)
tfidf_vectorizer = TfidfVectorizer(**tf_vectorizer.get_params())
dtm_tfidf = tfidf_vectorizer.fit_transform(docs_raw)Creating the Model
In this step, we will create the Topic Model of the current dataset so that we can visualize it using the pyLDAvis.
# for TF DTM
lda_tf = LatentDirichletAllocation(n_components=20, random_state=0)
lda_tf.fit(dtm_tf)
# for TFIDF DTM
lda_tfidf = LatentDirichletAllocation(n_components=20, random_state=0)
lda_tfidf.fit(dtm_tfidf)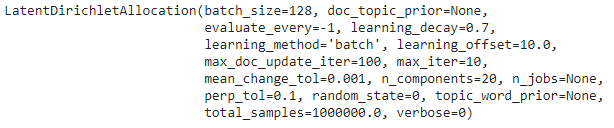
Creating Visualization
This is the final step where we will create the visualizations of the topic clusters. The best thing about pyLDAvis is that it is easy to use and creates visualization in a single line of code.
pyLDAvis.sklearn.prepare(lda_tf, dtm_tf, tf_vectorizer)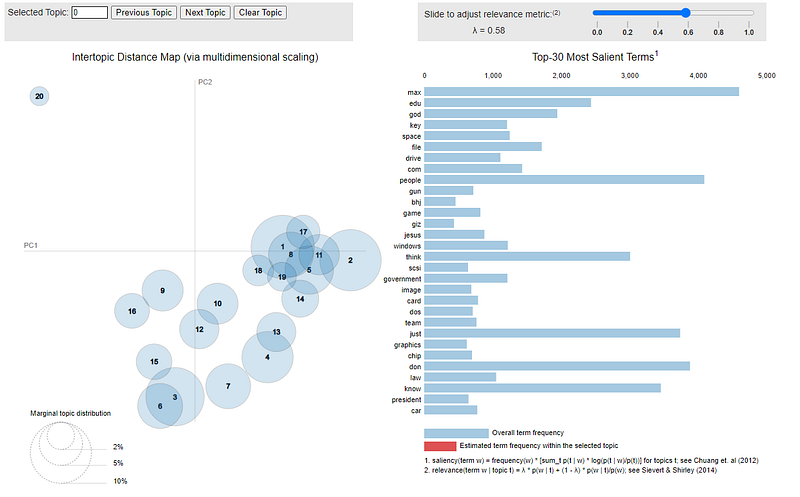
Check out the video below showing how interactive and visually appealing visualization is created by pyLDAvis.
Similarly, you can also create visualizations for TF-IDF vectorizer, etc. Go ahead try this and let me know your comments or any difficulty that you face in the comments section.
This post is in collaboration with Piyush Ingale.
Before You Go
Thanks for reading! If you want to get in touch with me, feel free to reach me at [email protected] or my LinkedIn Profile. You can view my Github profile for different data science projects and packages tutorials. Also, feel free to explore my profile and read different articles I have written related to Data Science.


