
Tom Demark’s Rate of Change Indicator for Trading
Creating and Coding the TD Rate of Change Indicator in Python

Tom Demark has created many indicators, among them his own rate of change indicator which is a contrarian indicator based on momentum.
I have released a new book after the success of my previous one “Trend Following Strategies in Python”. It features advanced contrarian indicators and strategies with a GitHub page dedicated to the continuously updated code. If you feel that this interests you, feel free to visit the below Amazon link (which contains a sample), or if you prefer to buy the PDF version, you could check the link at the end of the article.
The Normal Rate of Change Indicator
The rate of change of a security can be found by using the below formula:
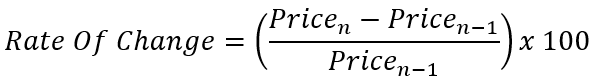
It describes the evolution of the value over time. If the previous price of a security was $100 and is now $110, then the rate of change will be 10%. This means that the market price increased by 10% since the previous period.
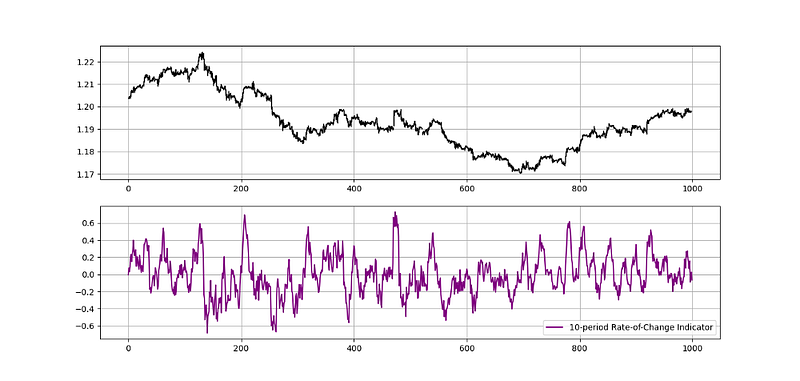
The Rate of Change Indicator is an oscillator that uses the above formula on a rolling basis and for a specified lookback period. A lookback period of 3 means that we will calculate the rate of change between the current price and the price 3 periods ago. The below plot shows an example of a 10-period lookback.
To code the Rate of Change Indicator in Python, we can use the following function:
def roc(Data, lookback, what, where):for i in range(len(Data)):Data[i, where] = ((Data[i, what] - Data[i - lookback, what]) / Data[i - lookback, what]) * 100
return Data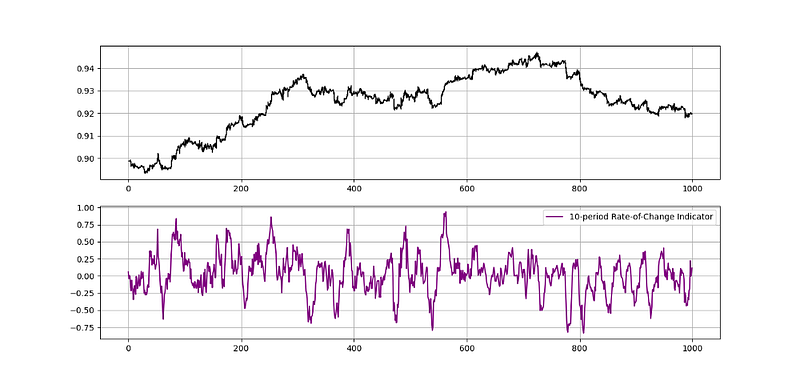
To be able to manipulate the data, we first need to have an OHLC array (not a data frame) and define the following three small manipulation functions:
# The function to add a certain number of columns
def adder(Data, times):

    for i in range(1, times + 1):

        z = np.zeros((len(Data), 1), dtype = float)
        Data = np.append(Data, z, axis = 1)
return Data# The function to deleter a certain number of columns
def deleter(Data, index, times):
for i in range(1, times + 1):
Data = np.delete(Data, index, axis = 1)
return Data# The function to delete a certain number of rows from the beginning
def jump(Data, jump):
Data = Data[jump:, ]
return DataMedium is a hub to interesting reads. I read a lot of articles before I decided to start writing. Consider joining Medium using my referral link (at NO additional cost to you).
Tom Demark’s Rate of Change Indicator
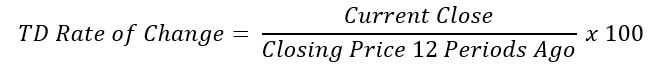
The version that Tom Demark has created uses a different lookback period and resembles the Momentum Indicator more than the Rate-of-Change Indicator. The formula for the TD Rate-of-Change is the following:
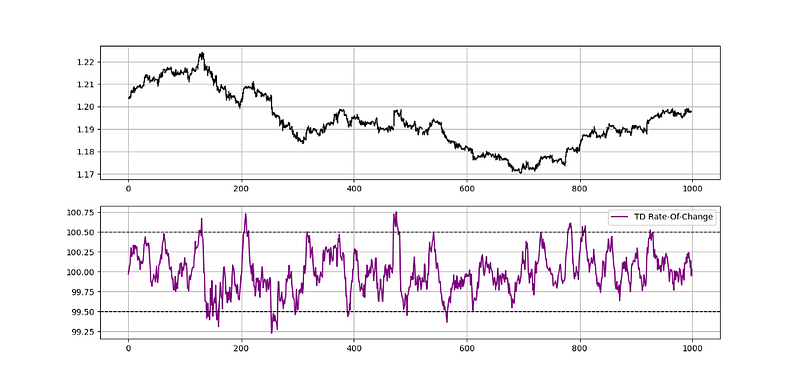
def td_roc_indicator(Data, what, where):

for i in range(len(Data)):Data[i, where] = Data[i, what] / Data[i - 12, what] * 100
Data = jump(Data, lookback)
return Data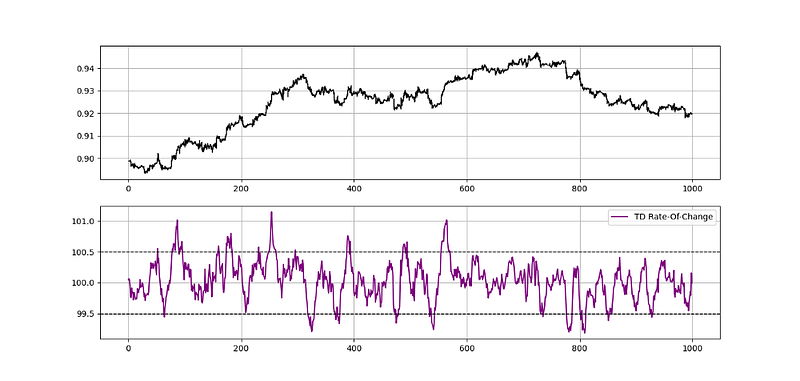
If you want to see how to create all sorts of algorithms yourself, feel free to check out Lumiwealth. From algorithmic trading to blockchain and machine learning, they have hands-on detailed courses that I highly recommend.
Summary
To sum up, what I am trying to do is to simply contribute to the world of objective technical analysis which is promoting more transparent techniques and strategies that need to be back-tested before being implemented. This way, technical analysis will get rid of the bad reputation of being subjective and scientifically unfounded.
I recommend you always follow the the below steps whenever you come across a trading technique or strategy:
- Have a critical mindset and get rid of any emotions.
- Back-test it using real life simulation and conditions.
- If you find potential, try optimizing it and running a forward test.
- Always include transaction costs and any slippage simulation in your tests.
- Always include risk management and position sizing in your tests.
Finally, even after making sure of the above, stay careful and monitor the strategy because market dynamics may shift and make the strategy unprofitable.


