

Tips, Tricks, & Techniques to Take Your Data Wrangling Skills to the Next Level
With diagrams, code, & examples
Data wrangling is perhaps one of the most difficult parts of data science. Be it cleaning out a very messy dataset or dramatically reshaping the data, wrangling data is every data scientist’s nightmare. There are many tips, tricks, and techniques, however, that can make manipulating data less so, and perhaps even can make it fun.
This article is broken down into four sections that cover various types of problems and solutions a data scientist may encounter when wrangling data: writing parser functions, making parsers more efficient, utilizing external sources, and reprojecting data onto blank templates.
< Writing Parser Functions />
An essential part of data cleaning is writing functions that parse a certain buggy column. For instance, a very common issue in data cleaning is that different cells in the same column have different naming/notation conventions, such that they cannot be properly compared. Usually, this will throw an error in whatever program you are writing, and can be confirmed by checking the unique values of a column with data[‘column’].unique().
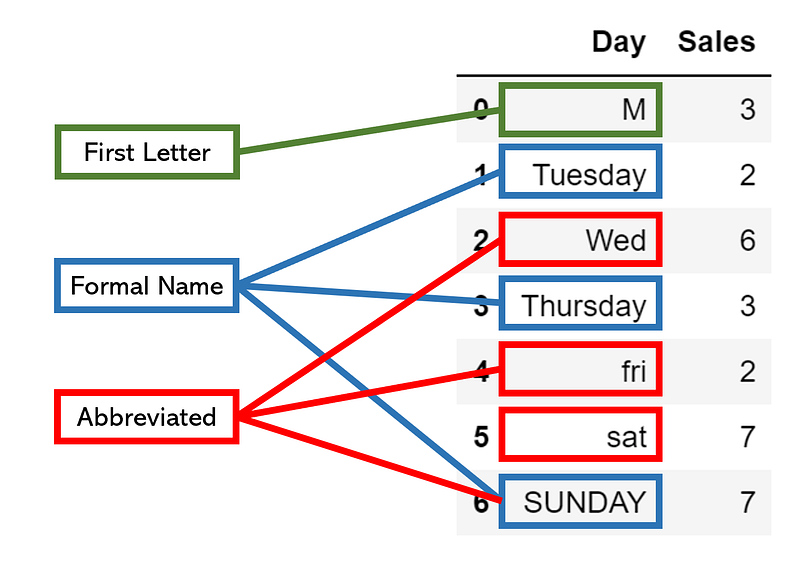
The first step in addressing different naming conventions — and a host of other similar problems — is to begin by identifying sets of notation by reviewing the column’s unique values closely. For example, in our hypothetical DataFrame, we have marked different notation standards, even with differences in capitalization that can easily be addressed by marking everything lowercase.
Once we have identified these sets of conventions, we can take two paths:
- Find an existing convention that is easy to convert to and write a function to transfer data in other standards to that convention.
- Create a new convention that is easy to convert to and interpretable.
In this case, if we want to convert the first letter convention to abbreviated or formal, we will need to add more information. Converting from formal to abbreviated is not difficult, but we still need to write if statements to detect if a cell is written in the formal convention. Generally, choosing a solution to problems that require the use of a parsing function fall along two principles:
- It’s easier to delete than it is to add. Adding requires writing conditions and introducing new information, whereas deleting simply requires knowledge of which part to delete.
- The smartest and easiest solution usually has the least if statements. It’s not always true, but a good principle to code by. The less if statements one needs to write, the faster you can code and not get caught in an entire tree of exceptions and ifs.
The best solution in this case is to simply select the first character from the data type. For existing first letter conventions, this will not have any effect, but it will easily convert the other two standards. We will need to write one if statement, however, that selects the first two characters if the first character begins with ‘s’ to distinguish between Saturday and Sunday. In addition, we will need to make everything lowercase for comparison.
This will look something like this:
When we apply this parser function to a column with code like data[‘Day’].apply(condense), the result is a consistent naming convention. Monday, Mon, and M are the same thing. Compare this small code with what it could have been if we didn’t sit down for a while and find the smartest solution — it may have been full of ifs and exceptions, whose abundance may have been the cause of an error.
Sometimes, you will not be able to have elegant solutions, and may need to manually program some information, like a conversion table between abbreviated and full-length names. The most organized way to do this is to create a dictionary, like so, which can be handily and cleanly referenced with dictionary[key].
Regardless, as long as the two principles are kept in mind — not only in the narrow scope of the differing conventions problem but in application to any data cleaning problem that requires the use of a parsing function, you should be able to construct error-free solutions in an organized and thoughtful manner.
< Making Parsers more Efficient />
When there is a complex parser that needs to be applied to an entire dataset, the runtime can grow enormously large, especially if the dataset has hundreds of thousands of rows.
First, it’s important to be able to diagnose extremely heavy runtimes. Although there are many alternatives out there, one of the best iteration-tracking libraries is tqdm. Import it with from tqdm import tqdm, and simply put it around any iterator: for i in tqdm(range(1000)):. The result will be a continually updating progress bar, which displays how fast each iteration runs, the number of iterations that have been run so far, and most importantly, the expected runtime. In this case, it is 1 minute and 20 seconds.
15%|█▌ | 15232508/100000000 [00:14<01:20, 1048877.51it/s]Because there is no way to check progress with data[‘col’].apply(func), if you suspect your script will run for too long, try applying the function iteratively with tqdm and take a look at the expected time. Sometimes, it may take hours, or even days. Another factor one must take into account is compounding runtimes — will the runtimes get larger and larger as the iteration increases?
Once the parser has been diagnosed with being too slow to run, the method that guarantees the largest drop in runtime is with Cython, a hybrid of Python and the much faster C. In Jupyter Notebooks, one can call Cython first by loading %load_ext Cython in a separate cell. Consider our function complex_parser, which takes in two variables — text and number — slightly transformed to meet Cython’s syntax.
There are a few noticeable changes: firstly, %%cython -a is typed at the top of the cell to activate Jupyter Notebook’s line magics. The most important change, however, is that the types of variables are declared. When they are created as parameters, declaring types is in the form type var_name, whereas outside it is cdef type var_name.
After running this cell, complex_parser will be saved as a Python function, and one can call something like data[‘col’].apply(complex_parser). By using Cython, functions can be tens or even hundreds of times faster, simply by calling the variable type. Because Python is ‘dynamically-typed’, meaning that variables are not attached to variable types, there is significant overhead that needs to be created in order for programmers to have the freedom to, say, add integers to floats. On the other hand, C is statically-typed, meaning that a variable can only hold one specific type of data, and integer variables cannot be added to float variables.
Cython brings the efficiency of static typing to Python by allowing creators to specify the only type of value a variable can take on, thus eliminating lots of unnecessary processing space and drastically speeding up the parsing process.
There are other methods to speed up your functions, for example by adding more exceptions, performing rigorous memory-usage assessments, and changing the way the code interacts with strings (notoriously slow to work with using conventional manipulation methods). You can read more about these computational cost savers here and about Cython here.
< Utilizing External Sources />
Especially if your data contains strong connections to the ‘real world’, like comments/tweets, lists of state/country names, etc., it may be helpful to use the help of external sources instead of trying to parse everything on your own.
For instance, typos are an issue in natural language processing analyses. Instead of trying to build a parser that catches every unique exception and misspelling you find in the data, try using existing libraries like pyspellchecker that can replace incorrect words with what the most probably correct word is.
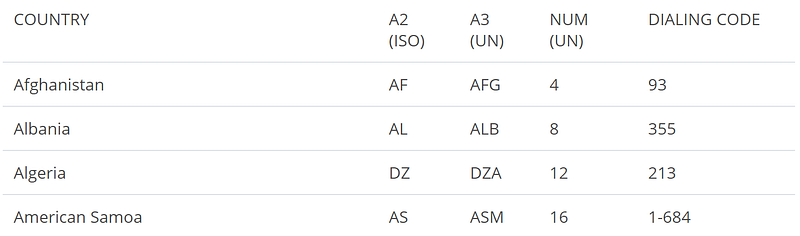
Or, for example, say that you have a dataset of phone numbers from company customers and would like to plot out on a map where these customers are from. This would be an impossible task if you didn’t open your analysis up to external references, like this handy table from the World Atlas.
We can get this data from the webpage into a DataFrame using pandas. Pandas reads all the html tables from a webpage and returns them in the form of a list, so the [0] index indicates that we are accessing the first table on the webpage.
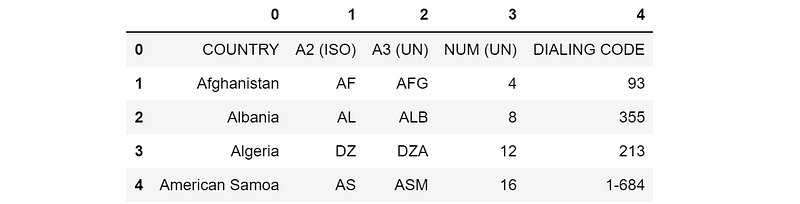
After setting the first row equal the column, you’re good to go in terms of converting from dialing codes to different country identification standards that geographical plotting libraries utilize. Don’t let your analysis or model be constricted by the data you have at hand: pulling in external data will significantly benefit the perspective of your dataset.
Some go-to resources for helpful tables include Wikipedia and WorldAtlas, which are one Google search away.
< Projecting Onto Blank Templates />
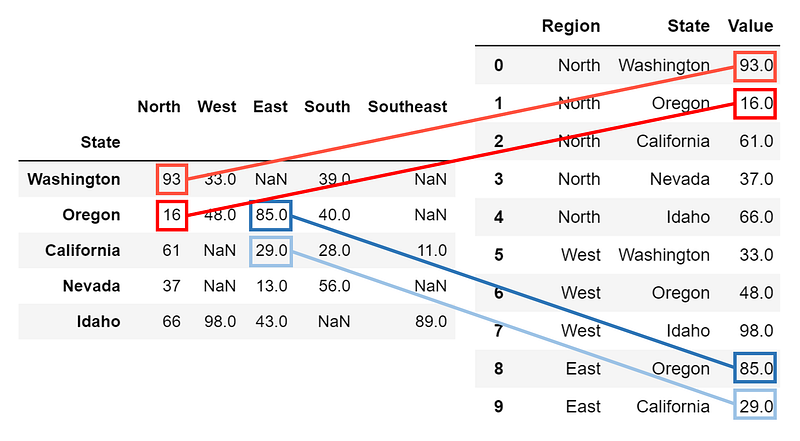
When data cleaning necessities are too complex, it may be a lot easier to iteratively project information onto a new table according to certain logical rules than to apply a series of complex parsing and data transformation functions, which may be entirely impossible altogether. As an example, consider the following table:
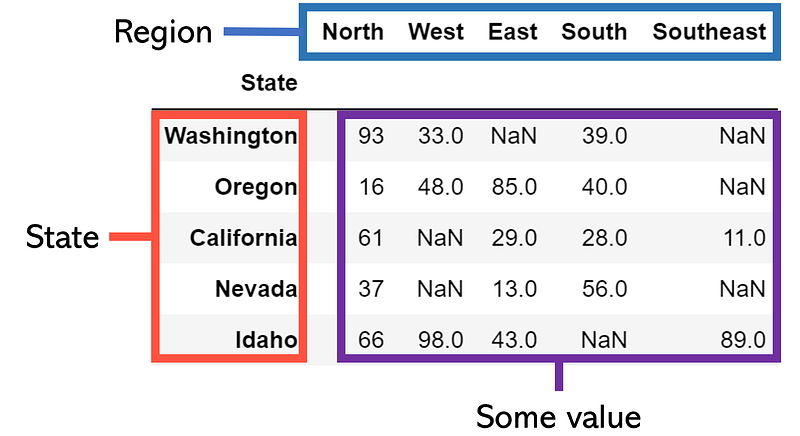
This table is two dimensional, not in that it has two dimensions — all tables are ‘2-d’ by that definition — but each value is defined by two axes. Instead, say that we want to convert it into a ‘one-dimensional table’ in that it only has three columns: Region, State, and Value, where each row is a unique combination of state and region. Instead of trying to somehow cleverly expand this table through dropping and altering, let’s begin by creating a blank template DataFrame and begin filling values in/appending new rows.
Let’s consider a simple iterator that loops through each of the values and adds them to a blank table along with the condition that they are not NaN.
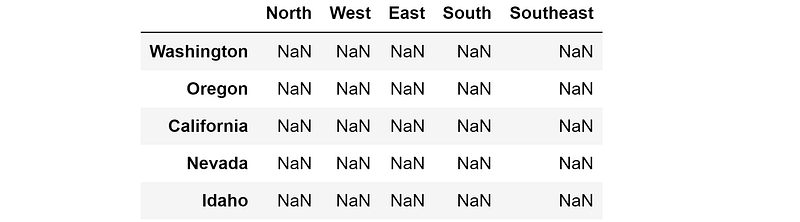
Going backward is a little bit more tricky. We will need to first create a pandas DataFrame with columns and indices based on the unique values in our list-form data. First, we collect the indices of our new table by finding the unique states in the State column. From here, we construct a nan_col, which is simply a list of NaNs that is the same length as the list indices, meaning that the column is as long as the index is. Lastly, we construct the full blank template new_table_2, which has one column of NaNs for each unique region.
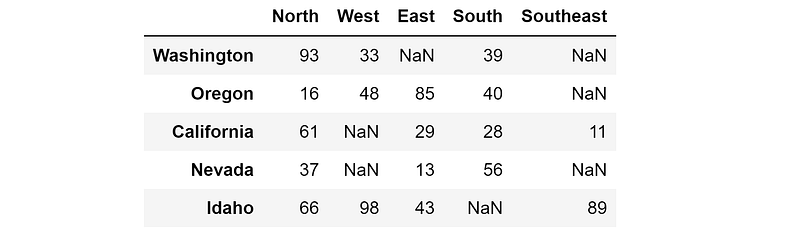
From here, for each value in the list, we can find the region, state, and value, looping through the rows and iteratively filling in the table.
Although this task was simple, many other complex data manipulations can be performed under the same idea of projecting the same data into a desired state. For any of these complex manipulations, follow these steps:
- Initialize a blank ‘template’. This is the form you want your current table to end up looking like. Define columns and indices, if necessary.
- Set up a looping mechanism. Create a series of for/while loops to cover the entire table, and consider using
itertools to drastically speed up your iteration time. - Within each iteration of the looping mechanism, create a logical mapping of information between that value and the template. You may need to keep track of columns, indices, and other information to properly transfer the information. If necessary, write conditionals.
Any data manipulation/cleaning problem can be solved in a simple fashion by utilizing data projection. Although it may not be the fastest method, it will be clear, understandable, and leaves almost no room for error.
< Key Points />
- Follow these two principles when constructing complex parsing functions: 1) it’s easier to delete than it is to add, and 2) the smartest and easiest solution usually has the least if statements.
- If you suspect your parser function has a huge runtime, diagnose it with an estimated time tool. Try declaring the data type of variables with Cython, which can dramatically speed up parsing time.
- Don’t let yourself be constricted by your current dataset. Pulling in external data from the web allows you to explore, visualize, and model data with a perspective you never could without it.
- Complex data manipulations are often better taken care of by projecting information onto the ideal ‘end shape’ of the data than by applying a series of difficult, complicated functions. The projection process is three-step: create the blank template, set up an iteration process, and establish the logical flow between a value in the old table and in the new table.


