
Stationarity For Time Series
A simple and intuitive explanation for the need of stationarity in time-series modelling.

Introduction
When trying to predict the weather, stock market or product sales we have to take into account some time component. For example, when predicting if it will snow tomorrow in the UK, we know the probability will be a lot higher in the winter months than summer months.
This type of time dependent data is best represented using time series. This is where each data point is ordered or indexed forwards in time. Predicting the next data point in a time series is very valuable and is called forecasting.
One requirement to accurately forecast the next data point is to ensure that the time series is stationary. In this article, we will discuss:
- What a stationary time series is
- How to make a time series stationary
- How to test that a time series is indeed stationary
- Why we need a stationary time series
If you want to learn more about Time-Series and Forecasting in general, refer to the book I have linked in the references section: Forecasting Principles and Practice.
What is Stationarity?
In general, a time series is stationary if it does not exhibit any long term trends or obvious seasonality. Mathematically we have:
- A constant variance through time
- A constant mean through time
- The statistical properties of the time series do not change
For example, consider the number of airline passengers as a function of time plotted below using a simple Python script:
Data sourced from Kaggle with a CC0 licence.
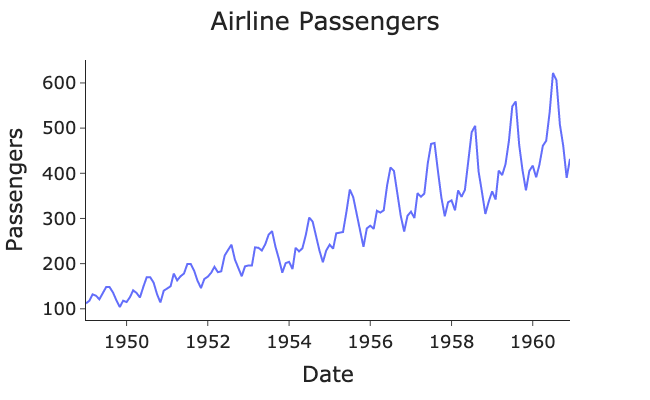
Is this time series stationary? No.
There is clearly a trend of the number of airline passengers increasing through time Additionally, the variance and fluctuations are also increasing in time. We will now go over methods to produce a stationary time series.
Making A Time Series Stationary
To make the time series stationary, we can apply transformations to the data.
Differencing Transform
The most common transformation is to difference the time series. This is calculating the numerical change between each successive data point. Mathematically, this is written as:

Where d(t) is the difference at time t between the data points y(t) and y(t-1).
We can plot the differenced data by using the diff() pandas method to simply calculate the differenced data as a column of our data-frame:
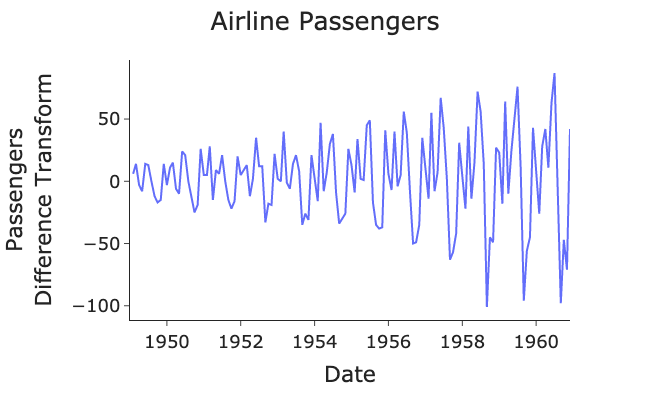
Is the data now stationary? No.
The mean is now constant and is oscillating about zero. However, we can clearly see the variance is still increasing through time.
Logarithmic Tranform
To stabilise the variance, we apply the natural logarithm transform to the original data:
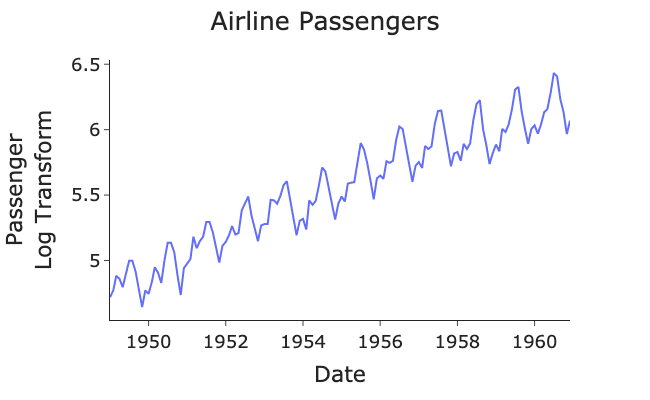
The fluctuations are now on a consistent scale, but there is still a trend. Therefore, we now again have to apply the difference transform.
Logarithmic and Difference Transform
Applying both logarithmic and difference transforms:
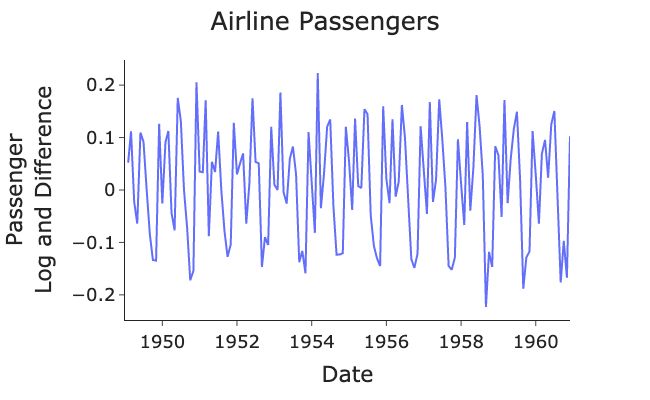
Is the data now stationary? Yes!
As we can see, the mean and variance is now constant and has no long term trend.
Testing For Stationarity
Visually, the data is now stationary. However, there are more quantitative techniques to determine if the data is indeed stationary.
One such method is the Augmented Dickey-Fuller (ADF) test. This is a statistical hypothesis test where the null hypothesis is the series is non-stationary (also known as a unit root test).
The statsmodels package provides an easy to use function for carrying out the ADF test:
Running this function we get the following output:
ADF Statistic: -2.717131
P-Value: 0.071121
Critical Values:
        1%: -3.48
        5%: -2.88
        10%: -2.58
Our ADF P-value (7.1%) is in-between the 5% and 10%, so depending on where you set your significance level we either reject or fail to reject the null hypothesis.
We can perhaps carry out further differencing to make it even more stationary if we want.
If your interested in learning in-depth how the ADF test mathematically works, refer to the links I provided in the references section.
The ADF test is not the only test available for stationarity, there is also the Kwiatkowski-Phillips-Schmidt-Shin (KPSS) Test. However, in this test the null hypothesis is that the trend is stationary.
To learn more about the process of hypothesis testing, see the references section.
Why Do We Need Stationarity?
The question still lies in why do we need to ensure our time series is stationary?
Well, there are a few reasons:
- Most forecasting model assume the data is stationary
- Stationarity helps to make each data point independent
- Makes the data, in general, easier to analyse
Conclusion
In this article we have described what a stationary time series is and how you can apply various transforms to make your data stationary. The log transform helps to stabilise the variance and the difference transfom stabilises the mean. We can then test for stationarity using the ADF test. The main importance of stationarity is that most forecasting models assume that the data holds that property. In my next article we will cover one of these forecasting models.
The full code that generated the data, plots and ADF test in this post can be viewed here:
Another Thing!
I have a free newsletter, Dishing the Data, where I share weekly tips for becoming a better Data Scientist, and the latest AI news to keep you in the loop. There is no “fluff” or “clickbait”, just pure actionable insights from a practicing Data Scientist.
References and Further Reading
- Forecasting: Principles and Practice: https://otexts.com/fpp2/
- ADF Test: https://www.machinelearningplus.com/time-series/augmented-dickey-fuller-test/
- Hypothesis Testing: https://towardsdatascience.com/z-test-simply-explained-80b346e0e239
Connect With Me!
(All emojis designed by OpenMoji — the open-source emoji and icon project. License: CC BY-SA 4.0)


