
Time Series Decomposition In Python
Time Series Analysis Made Easy

Time series decomposition is a technique that splits a time series into several components, each representing an underlying pattern category, trend, seasonality, and noise. In this tutorial, we will show you how to automatically decompose a time series with Python.
To begin with, let's talk a bit about the components of a time series:
Seasonality: describes the periodic signal in your time series. Trend: describes whether the time series is decreasing, constant, or increasing over time. Noise: describes what remains behind the separation of seasonality and trend from the time series. In other words, it’s the variability in the data that cannot be explained by the model.
For this example, we will use the Air Passengers Data from Kaggle.
import pandas as pd
import numpy as np
from statsmodels.tsa.seasonal import seasonal_decompose

#https://www.kaggle.com/rakannimer/air-passengers
df=pd.read_csv(‘AirPassengers.csv’)

df.head()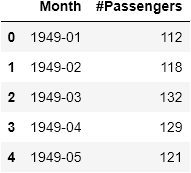
Firstly, we need to set as index the Month column and convert it into Datetime Object.
df.set_index('Month',inplace=True)
df.index=pd.to_datetime(df.index)#drop null values
df.dropna(inplace=True)
df.plot()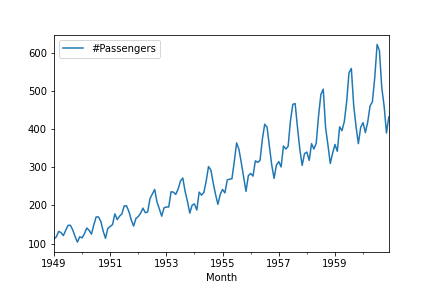
The Decomposition
We will use Pythons statsmodels function seasonal_decompose.
result=seasonal_decompose(df['#Passengers'], model='multiplicable', period=12)
In seasonal_decompose we have to set the model. We can either set the model to be Additive or Multiplicative. A rule of thumb for selecting the right model is to see in our plot if the trend and seasonal variation are relatively constant over time, in other words, linear. If yes, then we will select the Additive model. Otherwise, if the trend and seasonal variation increase or decrease over time then we use the Multiplicative model.
Our data here are aggregated by month. The period we want to analyze is by year so that's why we set the period to 12.
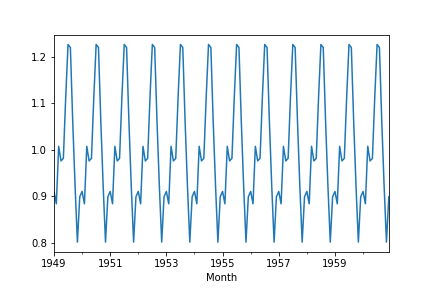
We can get each component as follows:
result.seasonal.plot()
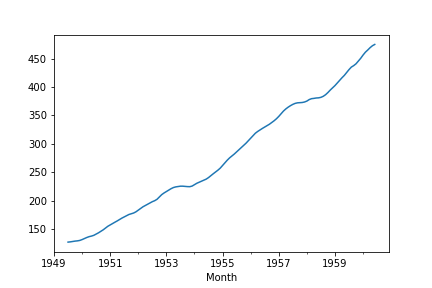
result.trend.plot()
Also, we can plot every component at once
result.plot()
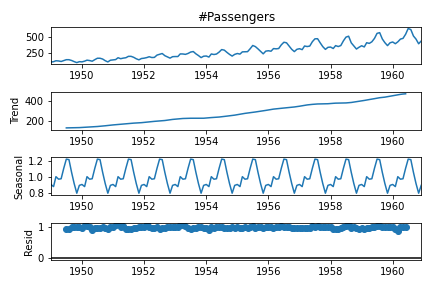
Wrapping up
Frequently, when looking at time series data it’s difficult to manually extract the trend or identify the seasonality. Fortunately, we can automatically decompose a time series and helps us have a clearer view of the components as It’s easier to analyze the trend if we remove the seasonality from our data and vise versa.
Want More From Me?: • Follow me on Medium • Add me on Linked In • Support me by signing up for Medium using my referral link .
Originally published at https://predictivehacks.com.


