
Three Things I Learned After Analyzing News Headlines With Python
An Exploratory Data Analysis of Major Publication Headlines

Introduction
I collected three weeks of headlines from the Wall Street Journal, The Washington Post, and the New York Times.
To collect the headlines, I wrote a Python script that scrapped the home pages of each publication and pushed the results to a Google Sheet. Then, I used a Google cloud function to schedule the script to run every thirty minutes.
If a headline changed for any publication, I recorded all three headlines as a new row of data in the spreadsheet. The resulting data followed this schema:

Here’s a link to the entire data set. I analyzed the headline data with Python and Pandas, which I cover in detail, including code explanations, below.
What were the three things I learned after the analysis?
Here’re three things I learned, with a fourth bonus lesson!
- The 24-hour news cycle is meant to feed an addiction.
- Publications focus on keywords that stir a response in their readers.
- Sometimes you need to see the data to believe a statement about media bias.
- The truth is always more complicated than it seems.
Keep reading if you’re curious about the data points that support these lessons!
Performing the data analysis
Now let’s get to the analysis. I’ll be using Pandas, Matplotlib, and Wordcloud.
In this article, I will focus on producing the following data points:
- number of unique headlines per publication
- total number of unique headlines
- top 5 longest-running headlines per publication
- a word cloud for each publication and a count of the most used words
I’ll be using Python and Pandas for the analysis, and for each data point, I will unpack the underlying code so that you can learn new techniques while exploring an intriguing topic.
Prepping the data
Let’s get started by importing what you need:
import pandas as pd
from wordcloud import WordCloud
from wordcloud import ImageColorGenerator
from wordcloud import STOPWORDS
import matplotlib.pyplot as plt
headlines = pd.read_csv('News Headlines - Headlines.csv')The TIME RECORDED column has text values that look like this “August 01,2022 11:00AM”. I need to convert these to proper date time objects. Here’s how:
# using pandas built in to_datetime methodheadlines['TIME RECORDED'] = pd.to_datetime(headlines['TIME RECORDED'], format='%B %d,%Y %I:%M%p', utc=False)#adding time zone offset informationheadlines['TIME RECORDED'] = headlines['TIME RECORDED'].dt.tz_localize('US/Eastern')Now I’m ready to produce each data point.
#1 Number of unique headlines per publication
Pandas makes retrieving this data point trivial. Here’s the code:
# unique headlines per publication
headlines[['WSJ', 'NY TIMES', 'WASHINGTON POST']].nunique(axis=0)
The nunique() data frame method returns the number of unique items along an axis. Here, I’m setting the axis to 0, which means Pandas counts unique items row-wise. As you can see, the output result is essentially a pivot table.
In three weeks, the Wall Street Journal published 117 distinct headlines, the New York Times published 101, and the Washington Post published 79.
Lesson 1: feeding an addiction. The sheer amount of headlines, and the rapidity with which they change, supports the conclusion that publications are content factories that must keep up with the demand for new headlines. The 24-hour news cycle is meant to keep us glued to a screen.
#2 Total number of unique headlines
I want to capture the total amount of unique headlines regardless of publication. There are multiple ways to produce this number. Let’s look at two.
Concatenating each column as a single list and converting to a set:
#total unique headlines

total_headlines = [*headlines['WSJ'].tolist(), *headlines['NY TIMES'].tolist(), *headlines['WASHINGTON POST'].tolist()]

total_unique_headlines = set(total_headlines)

print(len(total_unique_headlines))
=> prints 297You may not have seen the unpacking operator, *, used in Python. It is a very convenient operator that “unpacks” an iterable object by returning each item individually.
In this example, I create a list that includes the headlines from all three publications by 1) converting each data frame series to a list using tolist(), and 2) unpacking the elements of each list.
Lastly, I de-dupe the consolidated list of headlines by converting it to a set:
total_unique_headlines = set(total_headlines)Concatenating each column into a single series:
sum_of_headlines = pd.concat([headlines['WSJ'], headlines['NY TIMES'], headlines[
    'WASHINGTON POST']], ignore_index=True)

sum_of_headlines.nunique()
=> returns 297The second option is cleaner and feels less like a hack. I use pd.concat() to append each column into a single series. Then, I use nunique() like before to count the number of unique values in the series.
However, unlike before, nunique() is used on a series and not a data frame. Thus I do not have to specify an axis.
#3 The top 5 longest-running headlines per publication
Gathering this information will require a bit of work. The steps to implement are:
1. group each row by headline
- aggregate min and max date-time values for each headline
2. apply a function to each row that calculates the duration between min and max as a TimeDelta object
- handle edge cases where a headline didn't run for longer than 30 minutes
Here’s the full script:
wsj = headlines[['WSJ', 'TIME RECORDED']]
nytimes = headlines[['NY TIMES', 'TIME RECORDED']]
post = headlines[['WASHINGTON POST', 'TIME RECORDED']]
# group by and aggregationswsj_grouped = wsj.groupby('WSJ')['TIME RECORDED'].aggregate(['min', 'max'])
nytimes_grouped = nytimes.groupby('NY TIMES')['TIME RECORDED'].aggregate(['min', 'max'])
post_grouped = post.groupby('WASHINGTON POST')['TIME RECORDED'].aggregate(['min', 'max'])# thirty min time delta for edge case
thirty_minutes = pd.Timedelta(days=0, hours=0, minutes=30)# define a function to add calculated duration time delta duration(row):
if row['max'] == row['min']:
val = thirty_minutes
else:
val = row['max'] - row['min']
return val
# apply duration function to yield 'headline duration' column valuewsj_grouped['headline duration'] = wsj_grouped.apply(duration, axis=1)
nytimes_grouped['headline duration'] = nytimes_grouped.apply(duration, axis=1)
post_grouped['headline duration'] = post_grouped.apply(duration, axis=1)Exploring the outcome:
The top five longest-running headlines for the Wall Street Journal were:
1. Senate Passes Climate, Healthcare and Tax Bill for 0 days 15:30:002. Climate Bill Success Hinges on Timely Project Build-Out for 0 days 12:30:003. Jobs Return to Prepandemic Mark as Hiring Accelerates for 0 days 12:30:004. Disney Urged by Activist to Spin Off ESPN, Buy Hulu for 0 days 12:30:005. Pelosi Arrives in Taiwan, Defying China Warnings for 0 days 10:00:00The top five longest-running headlines for the New York Times were:
1. Files Seized From Trump Are Part of Espionage Act Inquiry for 0 days 18:00:002. Trump Lawyer Told Justice Dept. That Classified Material Had Been Returned for 0 days 17:00:003. Judge May Release Affidavit in Trump Search, but Only After Redaction for 0 days 14:00:004. Why Abortion Has Become a Centerpiece of Democratic TV Ads in 2022 for 0 days 13:30:005. How This Economic Moment Is Rewriting the Rules for 0 days 11:00:00The top five longest-running headlines for the Washington Post were:
1. FBI searched Trump’s home to look for nuclear documents and other items, sources say for 0 days 19:00:002. Trump’s dominance in GOP comes into focus, worrying some in his party for 0 days 14:30:003. Mar-a-Lago search appears focused on whether Trump, aides withheld items for 0 days 14:30:004. Amid tumultuous week, Trump takes the Fifth on hundreds of questions for 0 days 14:00:005. Russia’s spies misread Ukraine and misled Kremlin as war loomed for 0 days 14:00:00Lesson 2: Publications play to their reader’s anxieties and interests. From the top-five rankings, it’s clear that these publications prioritize running headlines that resonate with their audiences. Headlines that stir anxiety or produce a negative reaction are also a focus. This is most clearly supported by the New York Times and Washington Post’s emphasis on Trump.
#4 Word cloud for each publication and a count of the most used words
To generate a word cloud of the headlines for each publication, I will use the Python Wordcloud library. Here’s how to set up word clouds for each publication:
# import librariesimport pandas as pd
from wordcloud import WordCloud
from wordcloud import ImageColorGenerator
from wordcloud import STOPWORDS
import matplotlib.pyplot as plt# set up codestopwords = set(STOPWORDS)
wsj_text = ' '.join(i for i in set(wsj['WSJ']))
nytimes_text = ' '.join(i for i in set(nytimes['NY TIMES']))
post_text = ' '.join(i for i in set(post['WASHINGTON POST']))
wsj_wordcloud = WordCloud(stopwords=stopwords, background_color="white").generate(wsj_text)
# using matplotlib to plot Wall Street Journal Word Cloud
plt.figure(figsize=(15, 10))
plt.imshow(wsj_wordcloud, interpolation='bilinear')
plt.axis("off")
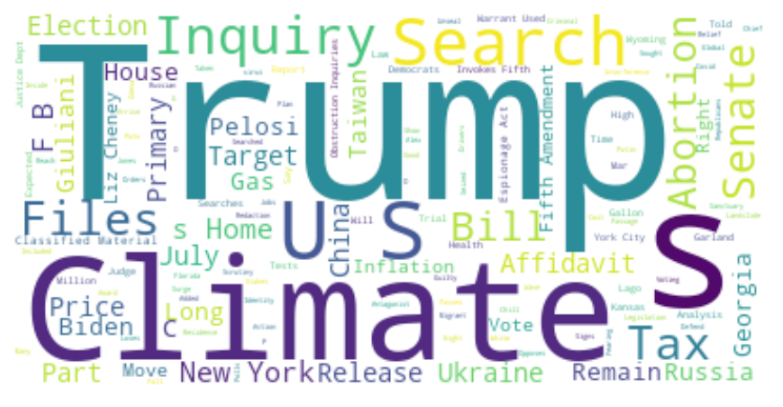
plt.show()Wall Street Journal:

New York Times:
Washington Post:
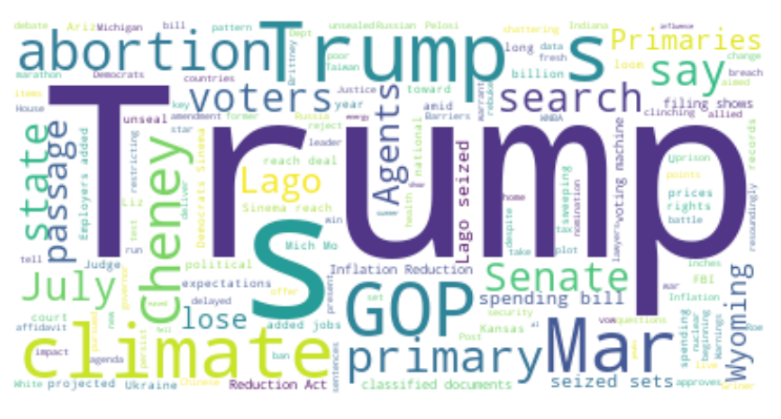
Lesson 2: Publications play to their reader’s anxieties and interests. Generally speaking, the Wall Street Journal is conservative, while the New York Times and Washington Post are liberal. The word clouds of each publication support that view. The Wall Street Journal emphasizes negative headlines about Nancy Pelosi (a Democrat), and the New York Times and Washington Post emphasize negative headlines about Donald Trump (a Republican).
What are the actual word counts?
The word clouds provide an idea of how often words appear, but the size of each word is a relative measure.
I was curious about the actual counts for each word, thinking that would tell a more accurate story.
Here’s the code I used to produce counts of the most frequently used words per publication:
# first, create a string containing each word from the headlineswsj_words = ' '.join(i for i in set(wsj['WSJ'])).split()nytimes_words = ' '.join(i for i in set(nytimes['NY TIMES'])).split()post_words = ' '.join(i for i in set(post['WASHINGTON POST'])).split()# second, convert each string into a list, removing pluralization and stopwordswsj_removed = [(i.replace("’s", "")) for i in wsj_words if i not in stopwords]
nytimes_removed = [(i.replace("’s", "")) for i in nytimes_words if i not in stopwords]
post_removed = [(i.replace("’s", "")) for i in post_words if i not in stopwords]# third, create data frames from the listswsj_df = pd.DataFrame({'word': wsj_removed})
ny_df = pd.DataFrame({'word': nytimes_removed})
post_df = pd.DataFrame({'word': post_removed})# finally, count the valueswsj_df.value_counts().head(4)
U.S. 19
Taiwan 18
Trump 16
Pelosi 15ny_df.value_counts().head(4)
Trump 30
U.S. 12
Climate 11
Inquiry 10post_df.value_counts().head(4)
Trump 18
Mar-a-Lago 8
GOP 8
spending 7Lesson 3: Sometimes, you need to see it to believe it. From the word counts, you can see that the New York Times published headlines that included the word “Trump” nearly twice as frequently as the Wall Street Journal and the Washington Post. I would have never assumed the Times would be an outlier in this way.
Why is the truth always more complicated than it seems
I’ve always considered myself an astute observer of media bias. Moreover, I’ve always thought that headlines, what they omit, emphasize, and their grammatical nuances, clearly reveal a political leaning. Given that belief, I assumed I could easily match a headline with its publication.
I created a simple online quiz to test my ability to identify headline bias: a headline is presented, and you select its publication.

You can play the quiz here: https://headlinequiz.com
After clicking through the headlines, what I found was surprising. To my dismay, I’m actually quite terrible at identifying where a headline was published.
So my trusted media literacy powers were just another victim of confirmation bias all along.
Lesson 4: The truth is out there, it’s just overly complex. We often believe excessively simplified versions of the truth out of convenience (like, for example, that news publications embed clear bias in headlines). Or because that simplified story fits what we want or assume to be true.
Conclusion
I hope you found this article intriguing and that it causes you to ask and answer new questions about media bias and data analytics. Hopefully, the conclusions you come to are not conclusions you already believe but conclusions your analysis has justified.