
Learn To Read Financial Statements Like A Pro (Part 2— Cashflow Statement)

Financial statements are not tough to read. It is just that they are taught in a highly boring and complex way.
Let me simply them for you.
We will walk through the financial statements of Apple (ticker symbol: AAPL) and learn to read them well.
In the last article of this series, we talked about an overview of financial statements and discussed the Balance Sheet in detail.
Let’s proceed and discuss how to read the Cashflow statement in this article.
Cashflow Statement
This statement is the account of how much cash a company is generating every quarter/ year.
I feel that this statement is a true reflection of a company’s financial condition as it reflects how much cash actually comes and goes out of the company.
Let’s go to Morningstar and find Apple’s (ticket symbol AAPL) Cashflow statement.
These financial statements can be found here.
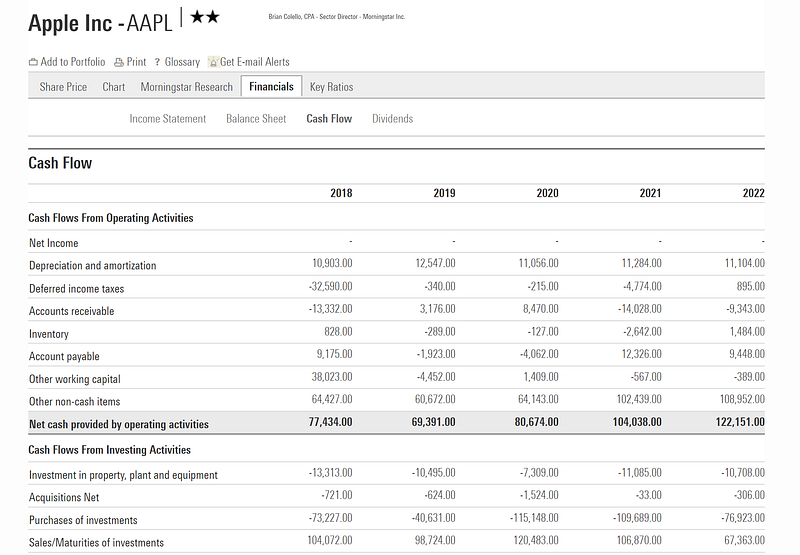
The Cashflow statement is divided into three sections:
- Cash Flows from Operating Activities
- Cash Flows from Investing Activities
- Cash Flows from Financing Activities
Let’s explore these sections one at a time.
Cash Flows from Operating Activities
This section tells us how much cash a company generates from its business operations.
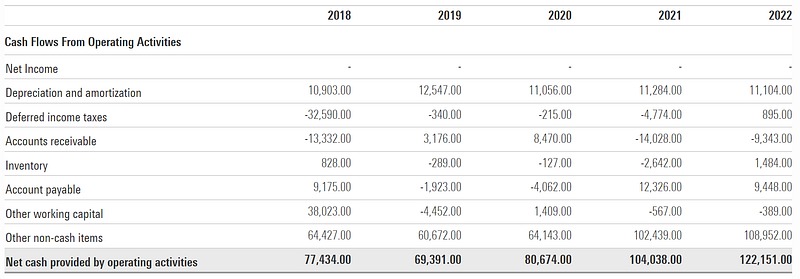
This section consists of the following:
- Net Income This represents the total amount of money a company has earned after deducting all expenses, taxes, interest, and other costs from its total revenue.
Net Income = Total Revenue — Total Expenses
- Depreciation & Amortization These tell how much an asset owned by a company has lost its value over its useful life.
Calculating these allows a company to spread the cost of these assets over time to reflect their decreasing value as they wear out.
Depreciation applies to Tangible assets such as buildings, equipment, vehicles, and machinery.
Amortization applies to intangible assets such as Patents, Copyrights, Trademarks, and Goodwill.
- Deferred Income Tax This tells the amount of income tax that a company will either owe or be entitled to in the future.
- Accounts Receivable This represents the money that is owed to a company by its customers for the goods/ services that have been delivered already.
- Inventory This represents the value of raw materials, unfinished goods, and finished goods that a company has.
- Accounts payable This represents the amount of money that a company owes to its suppliers and vendors for goods and services received on credit.
- Other Working Capital
Working capital is the difference between a company’s current assets and current liabilities. It consists of accounts receivable, inventory and accounts payable.
Other working capital represents the working capital that is not specifically categorized as accounts receivable, inventory, or accounts payable.
- Other non-cash items
These include accounting entries that do not involve actual cash transactions.
- Net Cash provided by Operating Activities
The total sum of all the cash that is generated from the company’s operations is represented at the end as ‘Net Cash provided by Operating Activities’.
This is also called the Operating cash flow and is an extremely important figure in determining the company’s cash-generating health.
Focus on this metric rather than just the Net Income of the company.
Cash Flows from Investing Activities
This section tells us how much cash a company generates from its investments.
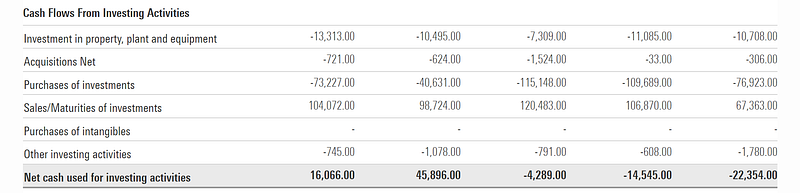
This section consists of the following:
- Investment in property, plant and equipment
This is the company’s investment in buying tangible assets that increase its production capacity / operational efficiency.
- Acquisitions Net
This includes the net cash obtained after a company acquires another company.
This represents the net cash i.e. cash spent to acquire a company net the cash inherited from the cash/cash equivalents of the acquired company.
- Purchases of investments
This represents the company’s investments in stocks, bonds, mutual funds, and other non-cash equivalent securities.
- Sales/Maturities of Investments
This represents the cash inflows resulting from the company's sale or maturity of previously held investments.
- Purchases of Intangibles
This represents the company’s investments in intangible assets (such as patents, copyrights, trademarks, and licenses).
- Other Investing Activities
This includes loans made to other entities, purchases or sales of subsidiaries, and other non-standard investing transactions.
- Net Cash Used for Investing Activities
This is the total sum of all the cash that is generated from the company’s investments.
Cash Flows from Financing Activities
This section tells us how much cash a company generates from its financing-related activities.
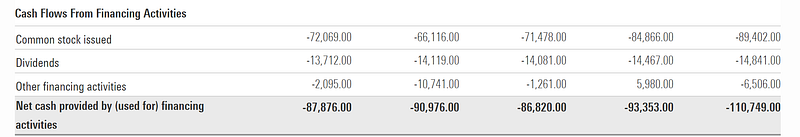
This section includes the following:
- Common stock issued
This includes all the cash generated by issuing common stock to investors.
- Preferred stock issued (not shown above)
This includes all the cash generated by issuing preferred stock to investors.
Preferred stocks pay a fixed dividend to shareholders, are prioritized in the event of bankruptcy, and are less impacted by market fluctuations than common stock.
Also, Preferred stock gives no voting rights to shareholders while common stock does.
- Dividends
This represents the cash paid to a company’s shareholders as dividends which is a return on their investment in the company’s stock.
- Other financing activities
This represents all miscellaneous financing transactions made by the company such as legal fees/ financing fees etc.
- Net Cash Provided by Financing Activities
This is the total sum of all the cash that is generated from the company’s financing activities.
The next section of the cashflow statement provides extremely important metrics. These are shown below.

Net change in cash
This is the total cash generated from operating, investing and financing activities by the company.
A rising trend every year reflects a strong economic moat for the company.
Free Cash Flow
Free Cash Flow = Cash Flow from Operating Activities / Operating Cash Flow — Capital Expenditures (Capex)
This is the money a company has left over after paying its:
- Operating expenses: Expenses that a business incurs through its normal business operations
- Capital expenditures: Money invested by a company to acquire tangible assets and intangible assets
In easy words, it is all the sales money left with a company after it has paid for its business expenses.
The annual percentage increases in Apple’s Free Cash Flow from 2018 to 2022 are as follows:
- 2018 to 2019: -8.17%
- 2019 to 2020: 24.62%
- 2020 to 2021: 26.66%
- 2021 to 2022: 19.90%
A company with consistently high and rising free cash flow has a strong economic moat.
That’s everything for this article. We will cover Income Statements in the next one!


