
Think Like a Trader: Make 5% in 5 Minutes
Using Technical Analysis (TA) to quickly find an entry and risk levels, closing at over 5% profit in less than half an hour.
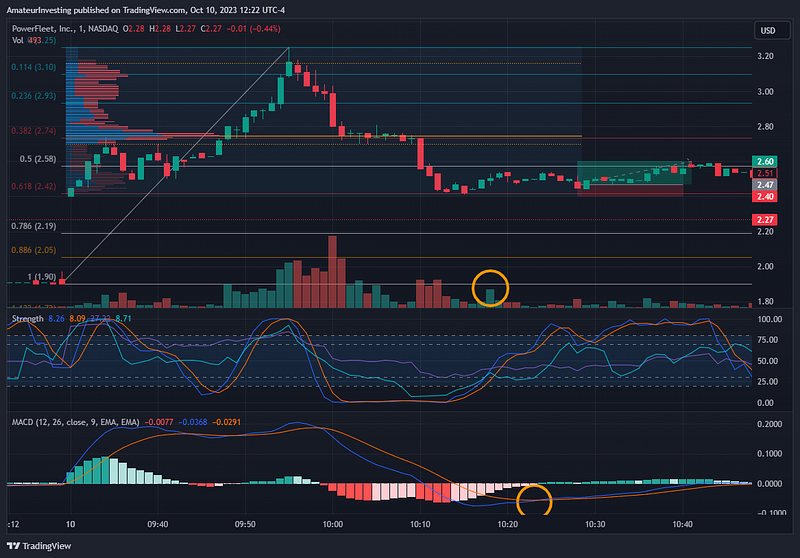
Before we get into the trade and how it came to be, it’s important that you know what you’re looking at. Charts can be confusing and everybody’s looks different, so here’s what’s on mine:
- Volume Profile: The blue and red horizontal bars are a volume profile from open to when I entered, showing where buys and sells were taking place.
- Fibonacci Retracement: The horizontal colored levels on the price chart is a fib retracement from yesterday’s close to today’s peak. The levels that matter in this example are the red 0.618 at $2.42 and the white 0.5 at $2.58.
- Long Entry: The trade taken is depicted by the green and red boxes, where the green is the profit and the red was the risk.
- Volume: This is shown by the vertical bars at the bottom of the price chart.
- Strength Indices: This is the middle chart. Purple is RSI, Blue is MFI, and Blue/Orange is the Stochastic RSI. These are all various oscillators to depict momentum and potential.
- MACD: This is the bottom chart. The histogram shows how far apart the two moving averages are.
Why This Ticker?
I missed open today, so I was looking for what stocks were “in play.” I found this PWFL through a screener searching for high relative volume. I have no idea what PowerFleet is, and with a quick trade like this, it really doesn’t matter.
Stocks “in play” can be risky but very profitable. This is due to their tendency to have fast and wide swings.
The Entry
I knew I had already missed the morning run, so I was looking to see if I could potentially catch a bounce. The 0.618 fib line is a very common bounce and I noticed that the stock already rejected this level.
Fib Levels
The 0.618 and the 0.382 (two red levels) often have full passes. I knew this wasn’t certian here because the stock had already blown through on the way down, but I thought a return to the top was possible. The 0.5 is in the middle, but this is often more of a hiccup zone than a pivot area.
Why 1 Minute?
I like to use the 1 minute chart for day trades because it gives me a poor man’s level 2 data. What I mean by this, is if there’s an abnormal spike in volume, this usually means that the abnormality was caused by one big player.
The abnormal volume was the first thing to catch my eye here.
Volume
In the first orange circle, I saw a bullish spike in volume towards the lower end of the day’s trading range. This gave me a hint that someone is looking to push the stock higher.
Additionally, the bulk of the volume profile was above the trading price at this point. Big volume spikes like that can act as both pivots and vacuums, sucking the price in then rejecting it.
Both of these aspects of Volume are bullish signals.
MACD Crossover
The second orange circle highlights that the MACD had a bullish crossover. I don’t personally think the MACD has any meaningful significance, but I know a lot of retail traders do. When you’re trading on a momentum play like this one, retail attention and expectation can make an impact.
Another bullish signal.
Strength
Stochastic RSI was on the way up and not yet at recent historic highs, so I knew there was room to grow. Similarly, both RSI and MFI had already bottomed and had lots of overhead.
All three of these are bullish.
Risk
I never take a trade unless there’s at least a realistic 1:1 ratio of reward to risk. I like using round numbers because those have strong psychological influence.
I saw the red fib at $2.42 and decided I wouldn’t want to be in the trade if it was under $2.40. Similarly, I thought a pivot at the 0.5 was possible, but figured a pivot at $2.60 was more realistic than $2.58.
If I were to put a stop loss at $2.40 and a take profit at $2.60, then so long as I enter under $2.50 or under, I’ll have a good r:r.
Buying in
When I saw the big red candle on low volume, I expected a quick snap back up and bought on the close. My entry was $2.47.
The Trade
After I was in on the trade, I set my take profit and stop loss to set off automatically. This way, I’m not staring at the chart and my emotions can’t get in the way. After about 5 minutes of work I was in the trade.
When I hit my first profit target, I sell half my shares and increase the stop loss for the remainder to my entry level. This way, I literally can’t lose money and there’s a chance for a longer run.
This didn’t play out today, but regardless, I was able to take profit on an over 5% move that took barely any time to plan. This is how traders make money.
Your Thoughts?
What did you think? Would you have made the same trade? What would you have done differently?
Thanks for reading. If you enjoyed this article and would like more content like this, please give me a follow.
Peace ✌


