
There’s An API To Get Your Partner Program Earnings — But It’s Not What You Think (Pt. 2)
Create a functional Python script, deploy your build to a cloud function and schedule an automated report to your email.
I need your help. Take a minute to answer a 3-question survey to tell me how I can help you outside this blog. All responses receive a free gift.
Use Python And SQL To Create An Earnings Dashboard
This walkthrough builds on elements of part I including connecting to the Stripe API, parsing returned data and conducting quality assurance so your numbers are correct. In part II, we’ll transform this build from static code to a dynamic deployment you can use to import your earnings every month.
I began using this method about 2 months ago to ingest gross earnings.
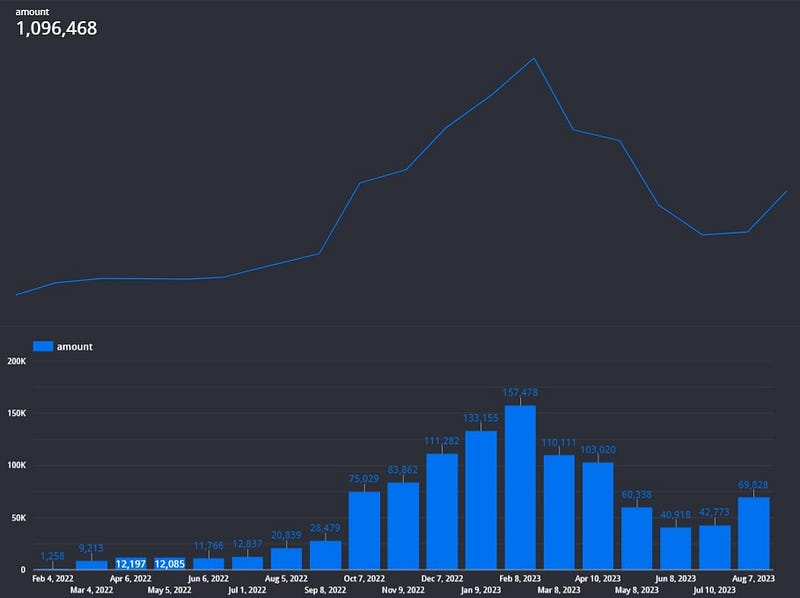
The expected output is this viz with (obviously) dummy data.
First, if you need to understand the “big picture” of deployment and the processes I’ll be referring to, I wrote on the subject a little while ago.
Otherwise, we’ll begin by solving the first of several problems: How often do we really need this data and how can we avoid unnecessary runs (and associated costs)?
Before we jump into the code, we need to understand when this data is available.
Note that, to access the data, I’m concerned with when the earnings data is available in Stripe, not when it is transferred to my bank account.
In my case, my earnings are typically transferred to Stripe between the first and second weeks of a new month. This can be as early as the 6th and as late as the 11th.
I arrived at that conclusion both through personal experience and by running this query (once the data is ingested, of course):
SELECT ROUND(AVG(arrival_day), 2) AS avg_day, ROUND(MAX(arrival_day), 2) AS max_day, ROUND(MIN(arrival_day), 2) AS min_day
FROM (
SELECT arrival_date, SAFE_CAST(EXTRACT(DAY FROM arrival_date) AS INT) AS arrival_day
FROM `ornate-reef-332816.stripe.payout`
)
WHERE EXTRACT(YEAR FROM arrival_date) = 2023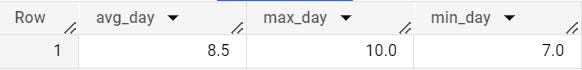
Knowing this date range will help with scheduling. Additionally, it will also help me filter my data frame so I’m only getting the latest data.
Pardon the interruption: To receive more data science-oriented content, consider following Pipeline.
To receive my latest writing, you can follow me as well.
Again, once I’ve backfilled the table, I only want 1 months’ worth of data.
We can filter the data frame with 1lines of code, filtering for the current month.
df = df[df['arrival_date'].dt.month==cfg.current_month]But we don’t just want to ingest this data blindly. Before I transfer the data to BigQuery I want to first double-check and make sure that I haven’t already imported data for the current month.
To accomplish this, I need to set a variable for the current month in the Python script:
from datetime import datetime as dt
current_month = dt.now().month
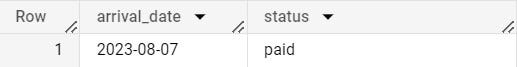
current_year = dt.now().yearAND write a quick SQL query to check the existing values in the payout table.
SELECT * FROM `ornate-reef-332816.stripe.payout`
WHERE EXTRACT(MONTH FROM arrival_date) = EXTRACT(MONTH FROM CURRENT_DATE("America/New_York"))
AND EXTRACT (YEAR FROM arrival_date) = EXTRACT(YEAR FROM CURRENT_DATE("America/New_York"))
By combining Python and SQL we can write a neat little dynamic query that does the job.
query = f"""

SELECT * FROM `ornate-reef-332816.stripe.payout`
WHERE EXTRACT(MONTH FROM arrival_date) = {current_month}
AND EXTRACT (YEAR FROM arrival_date) = {current_year}

"""

Creating A Filter To Avoid Duplication — Plus The Main Script
We can then establish conditional logic to ingest this data only if it doesn’t already exist in the table and the data frame we’ve created has a length greater than 0.
if len(df) > 0:

    logging.info(f"Uploading to {cfg.dataset}.{cfg.table}")

    upload_to_bq(df, cfg.dataset, cfg.table, cfg.schema)

    logging.info(f"{cfg.dataset}.{cfg.table} updated with earnings from month: {cfg.current_month}")

else:

    logging.info(f"No data available for month: {cfg.current_month}")
Finally, I add a date updated field (dt_updated) so I know when the last time we ingested a row of payout data.
df['dt_updated'] = pd.Timestamp.now("US/Eastern")After this work, we’ll have a main script that looks like this:
import requests
import pandas as pd
from datetime import datetime as dt
import os
from google.cloud import bigquery
from google.cloud import storage
import logging
import google.cloud.logging
import config as cfg
import json

logging.basicConfig(format='%(asctime)s %(levelname)s:%(message)s', level=logging.INFO, datefmt='%I:%M:%S')

client = google.cloud.logging.Client()
client.setup_logging()

bq_client = bigquery.Client()

storage_client = storage.Client()

gcp_bucket = storage.Client().get_bucket(cfg.bucket)

gcp_blob = gcp_bucket.blob(cfg.file)
token = gcp_blob.download_as_string()
token = json.loads(token)

def upload_to_bq(df: pd.DataFrame, dataset_id: str, table_id: str, schema: list):

    dataset_ref = bq_client.dataset(dataset_id)
    table_ref = dataset_ref.table(table_id)

    job_config = bigquery.LoadJobConfig()
    job_config.write_disposition='WRITE_APPEND'
    job_config.source_format = bigquery.SourceFormat.CSV
    job_config.schema = schema
    job_config.ignore_unknown_values=True

    job = bq_client.load_table_from_dataframe(
    df,
    table_ref,
    location='US',
    job_config=job_config)

    return job.result()

def make_request(url, token):

    logging.info("Making request to Stripe 'payout' end point...")

    req = requests.get(url, headers=token)

    logging.info(f"Response: {req.status_code}")

    if req.status_code == 200:
        data = req.json()['data']

        return data
    else:
        logging.info(f"Response is {req.status_code}.")

        return 0

def format_df(data):

    df = pd.DataFrame(data)

    df['amount'] = df['amount'].astype(float) / 100
    df = df[cfg.initial_cols]
    df['arrival_date'] = pd.to_datetime(df['arrival_date'], unit='s')

    df = df[df['arrival_date'].dt.month==cfg.current_month]

    df['arrival_date'] = df['arrival_date'].dt.strftime("%Y-%m-%d")

    df['dt_updated'] = pd.Timestamp.now("US/Eastern")
    df = df[cfg.final_cols]

    return df

def stripe_payout_etl(event, context):

    logging.info(f"Checking values in {cfg.dataset}.{cfg.table}...")

    current_dt_check = bq_client.query(cfg.query).to_dataframe()

    data = make_request(cfg.base_url, token)

    if data:

        logging.info("Creating data frame...")

        df = format_df(data)

        if len(df) > 0:

            logging.info(f"Uploading to {cfg.dataset}.{cfg.table}")

            upload_to_bq(df, cfg.dataset, cfg.table, cfg.schema)

            logging.info(f"{cfg.dataset}.{cfg.table} updated with earnings from month: {cfg.current_month}")

        else:

            logging.info(f"No data available for month: {cfg.current_month}")

    else:

        logging.info("Data unavailable!")

if __name__ == "__main__":
    logging.info(f"Fetching Stripe payout data for month: {cfg.current_month}")
    stripe_payout_etl("","")
Since this isn’t doing us any good in its manual state, we need to create infrastructure for deployment.
Deploy Your Build To Create An Automated Earnings Report
I work with a GCP stack, so I like using GitHub Actions with GCP to maintain, update and deploy code.
This is all accomplished using a .yaml file, which you can easily create in the GitHub UI (or your preferred environment).
In this case we need 2 steps:
- Auth
- Deploy
For the auth step you’ll want to make sure of 3 things:
- You’ve created or assigned a service account to handle the deployment
- You’ve obtained the corresponding credentials file for that service account
- You’ve stored the credentials as secrets in GitHub
Here is the yaml file for reference:
name: stripe_payout_etl

on:

  workflow_dispatch:

  push:
    branches: [ main ]
    paths:
    - "stripe_payout_etl**"

jobs:

  build:

    runs-on: ubuntu-latest

    steps:

      - uses: actions/checkout@v2

      - name: auth
        uses: google-github-actions/auth@v1
        with:
          credentials_json: ${{ secrets.GCP_SECRET }}


      - name: Deploy
        uses: google-github-actions/deploy-cloud-functions@main
        with:
          name: stripe_payout_etl
          runtime: python37
          project_id: ornate-reef-332816
          event_trigger_type: providers/cloud.pubsub/eventTypes/topic.publish
          event_trigger_resource: projects/ornate-reef-332816/topics/stripe_payout_etl
          source_dir: ./stripe_payout_etl/
          timeout: 540
          memory_mb: 1024
Taking the time to double-check your first step will make the second step, Deploy, much less time-consuming and frustrating.
One of the most important parts of the Deploy step is configuring the event trigger, since this will create the pub/sub topic that you’ll use to schedule the recurring runs of this cloud function.
The other lines to pay attention to include the timeout (cloud functions have a maximum timeout parameter of 9 minutes or 540 seconds) and the memory you allocate to a run, in GB increments (1024 MB = 1 GB).
And, to make sure the process references your files correctly, you’ll want to ensure that you specify the correct path with the source directory. I’ve had several deployments fail because I’ve omitted this step.
Once your deployment succeeds (and I really hope it does), you’ll need to schedule the run time.
As I mentioned earlier, I don’t want this to run more than once a month.
Since I have a decent date range in mind, I know that data should be available by at least the 11th of every month. So that’s the day I’ll choose to run this and load the data. To configure the run, I’ll create a cron job.
Schedule Your Report — And A Look At The Final Product
Once you’ve successfully deployed your cloud function and you’ve set up a monthly schedule, take a minute to test the function in the UI.
It’s disheartening if it fails, but at least you have the extra assurance knowing your build works, or you find out what you need to fix.
After we’ve assured that the table updates on a monthly basis, we can create the visualization in our BI tool of choice.
In my case, it’s Looker Studio.
For my earnings viz, I keep it really simple.
I create a bar graph of earnings by month and then have the gross total displayed above.
It’s also worth considering the tweaks you can make to create a more legible, compelling visualization:
To ensure that this report is sent to you on a recurring basis, you can schedule the report in the Looker Studio UI.
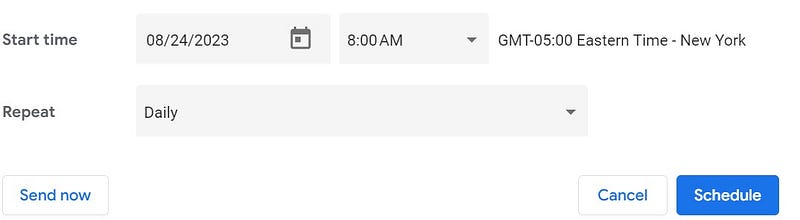
…And now you can see it in PDF form in your inbox.
Takeaway — Start Your Own Build
Completing this build was a data chore I had been putting off for a while. After creating a dashboard with my story analytics I knew I eventually needed to find a way to integrate earnings if I was going to fully replicate the Stats UI.
Since writing income can be really variable I find that tracking earnings is less about trying to arrive at some kind of consistency than it is about creating and maintaining motivation. Money isn’t my sole motivation, but it’s satisfying to watch hard work result in a couple of bucks in the bank.
My hope is that this series taught you not only how to obtain your own earnings data, but that it reinforced the importance of understanding where your data lives and how to make it actionable.
Create a job-worthy data portfolio. Learn how with my free project guide.


