
The value of the p-value
Why “p-value<0.05” is not enough

The interpretation of p-value is one of the most misunderstood subjects in science and statistics, not only by the general public but also for Academia. This leads to low-quality publications and misleading news, with a consequent distrust in Science. Just stating “p<0.05 = good” and “p-value≥0.05 = bad” is a dangerous oversimplification.
This article tries to debug some concepts, focusing on:
- Data distribution and description
- Hypothesis testing
- The value of the p-value
- Practical limitations of the p-value
- How to choose the test to calculate the p-value?
1. Data distribution and description
Let’s take, for example, the height in adult men vs women. Empirically, we all know that on average men are taller than women (we are talking about big numbers). But what if we did not know this and ask ourselves…
Is there a difference between the height of adult men vs adult women?
To answer this question objectively, we have to design a study to test a hypothesis.
After sampling 100 men and 100 women we list their height (in cm) in a table, arriving at the following numbers….
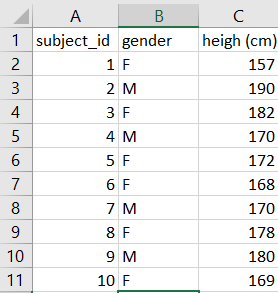
Let’s say height is normally distributed and we found the following results:
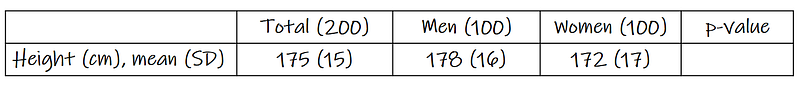
In this sample, the average man is 6cm taller than the average woman (178–172).
Normally and other distributions will be approached in another publication…
Is the difference in our sample likely to be observed in the broad population?
2. Hypothesis testing
When we enter the world of hypothesis testing (at least in classic statistics, we are not touching Bayesian Statistics here), we have to think of two hypotheses.
- H0: Null hypothesis — the default no-difference hypothesis we are trying to reject. In this specific example; there is NO difference in the average height of men and women.
- H1: Alternative hypothesis — the difference hypothesis. In this example, there is a difference in the average height of men and women. Note we are saying there is a difference without telling who is taller (this is a so-called two-tailed p-test).
Here we have 4 possible hypotheses:
- True positive: We find a difference (we reject the H0) when there is a real difference. Here enters Power; The chance of detecting an effect/difference when there is really an effect/difference.
- True negative: We find no difference (we fail to reject the H0) when there is no real difference
- False positive: We find a difference (we reject the H0) when there is no real difference. Type 1 error (α).
- False negative: We find no difference (we fail to reject the H0) when there is a real difference. Type 2 error (β).
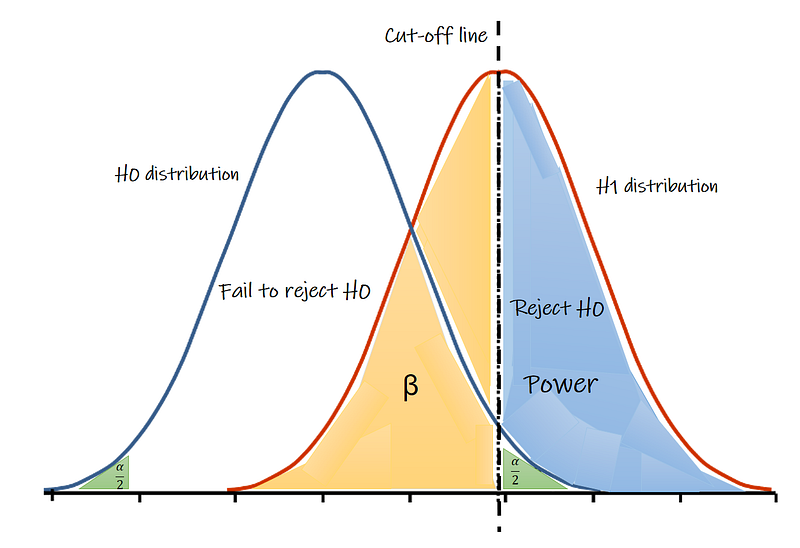
Usually, α (type 1 error) has a value of 0.05 meaning we accept a 5% chance of type 1 error (false positive) and β (type 2 error) has a value higher to 0.8 or 0.9, meaning we accept a 20% or 10% change, respectively, of having a type 2 error (false negative).
In fact, according to the cut-off we choose (the position of the dotted vertical line) there is a trade-off between type 1 and type 2 errors. But that will be the topic for a different article…
But until now we only approached data distribution, hypothesis testing, and type 1 and type 2 errors. Where are the p-values? Just hold on, in the end, all will make sense
3. The value of the p-value
When testing differences, the p-value only tells us one thing; Is the difference found statistically significant?
A p-value of 0.04 means there is a 4% of finding the results we found if the null hypothesis was true
In other words…
- A p-value of 0.30 means that if the null hypothesis was true (eg: there is no difference in height between groups), there is a 30% chance of findings the observed results. This sounds like a likely event.
- A p-value of 0.04 means that if the null hypothesis was true(there is no difference in height between groups), there is only a 4% chance of finding the results we found. This does not sound like a likely event, meaning that these results are more likely to be found under an alternative distribution (if there was a difference between groups).
A p-value by itself has NO meaning it needs a meaningful question and consequently, an underlying hypothesis to be tested — data fishing is not science
How to tell if the result found is statistically significant. Enter type 1 error…
If the p-value (the result we get) is lower than the cut-off for α (the value we defined a priori, which is usually 0.05) we are saying;
- That we fell comfortable accepting a 5% chance of having a false positive;
- If p-value<α (eg; p-value=0.04), we reject the null hypothesis and say there is a statistically relevant difference, but if p-value≥α (eg; p-value=0.30) we cannot reject the null hypothesis and there is no statistically relevant difference.
When we fail to reject our null hypothesis we are not “accepting” it. Null hypothesis testing doesn’t allow us to accept a “null hypothesis” or provide evidence that the null is true. We only failed to provide evidence that it’s false.
4. Practical limitations of the p-value
So, next time you see a p-value ask yourself. What are you testing here? Most importantly, p-values are not a universal way to test a hypothesis, we need to check all these other things;
- Who is represented by this sample? What about the intrinsic and extrinsic validity? If I am studying height in adults I cannot conclude anything in children.
- Which sources of bias may be present? Have I assessed a representative sample or am I assessing the height of people who have a disease that shortens their height?
- Which forms of confounding may be present?
- Are authors choosing a valid test to calculate the p-value? For example normal and non-normal distributions… A Student t-test is not an adequate choice for a continuous variable that is not normally distributed.
- What is the test power? Do the authors report the test Power? A rule of thumb is to have at least 80% or 90% Power, or a change of 20% to 10% of type 2 error (β) respectively (Power = 1-β).
- Last but not least. Is the difference clinically significant? I could run a trial and state that “MagicdrugA” lowers blood pressure when compared to placebo, because of the p-value<0.05. However, if the mean difference is only 2mmHg in systolic blood pressure this may not be a relevant effect.
Please never buy the sales pitch “there is a tendency toward” “there is a trend” for a p-value of 0.06. p-values are defined a priori, so there can only be a Yes/No answer. There is not such a thing as almost significant.
5. How to choose the test to calculate the p-value?
The trick is… there is no need to memorize all tests. Just try to understand the kind of variables you are assessing and know how to use a good “cheat sheet” to write the syntax into the Statistical Software of your choice.
This UCLA website is an amazing source with all the syntax you need for; Stata, SAS, R, and SPSS.
- Dependency of observations
- Independent observations;
- Dependent observations;
2. Type of variable to be compared
- Continuous
- Discrete
3. How many groups (levels)?
- 2 groups
- More than 2 groups
This is all about making the right choices. Statistical analysis software is great at doing what you ask. If you input a binary variable (where 0=is “absence of event” and 1= “presence of event”) and ask your software to run a test as if it was a continuous variable the program will assume you are using a continuous variable that ranges from 0 to 1 and show a result. For more about syntax and semantic errors check this article.
Disclaimer
All given examples are made for educational purposes and do not necessarily convey the current state of the art. None of this information is intended to provide any Medical Advice.


