
The Ultimate Non-technical Blueprint To Business Statistics
In today’s business world, only those who know how to make data work for them will thrive.

Why should you care about Business Statistics?
Our world today is a data-driven world — statistics is the future — it will be a strong asset for non-technical jobs and management positions. If you don’t know how statistics work in business, you might fall behind.
Here’s what you’ll take away from this post:
- Gain a holistic view of where statistics are used in business decisions
- Understand how it’s applied — the core statistical process
- Learn the 3 most important applications of business statistics — regression, time series modeling, and process control (no formulas)
1 — How Statistics Drives Business Decisions
What is Business Statistics?
Using mathematical & statistical techniques to analyze business data.
Traditionally, statistics is divided into two areas, Descriptive & Inferential. Descriptive Statistics tells us “what happened” and “when it happened”, and Inferential Statistics tells us “how it happened” and “why it happened”.
When applying statistics to business data analytics, it’s broken down into 4 smaller parts.
The 4 Business Applications of Statistics
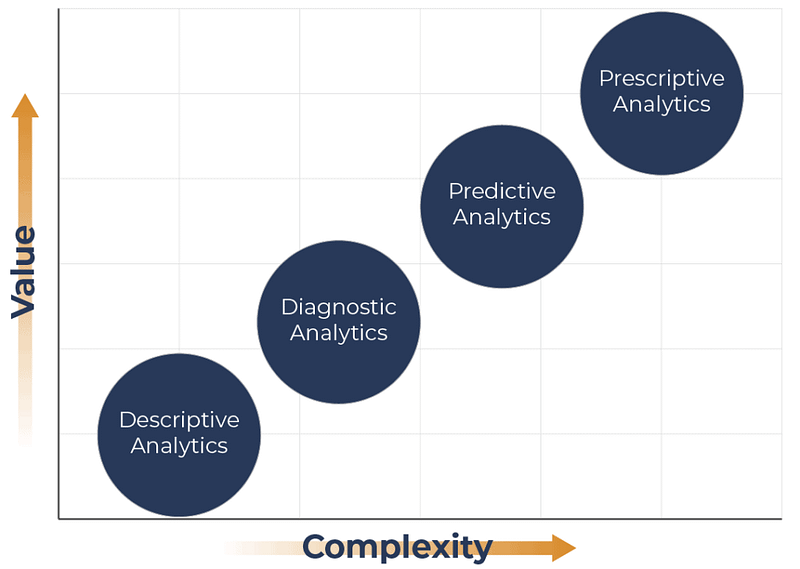
- Descriptive Analytics answers “what happened”
- Diagnostic Analytics answers “why it happened”
- Predictive Analytics answers “what will happen next”
- Prescriptive Analytics answers “what we should do”
You will notice that these cover almost all business decisions — this is why statistics and data are so closely tied to every part of a business.
2 — The Statistical Process
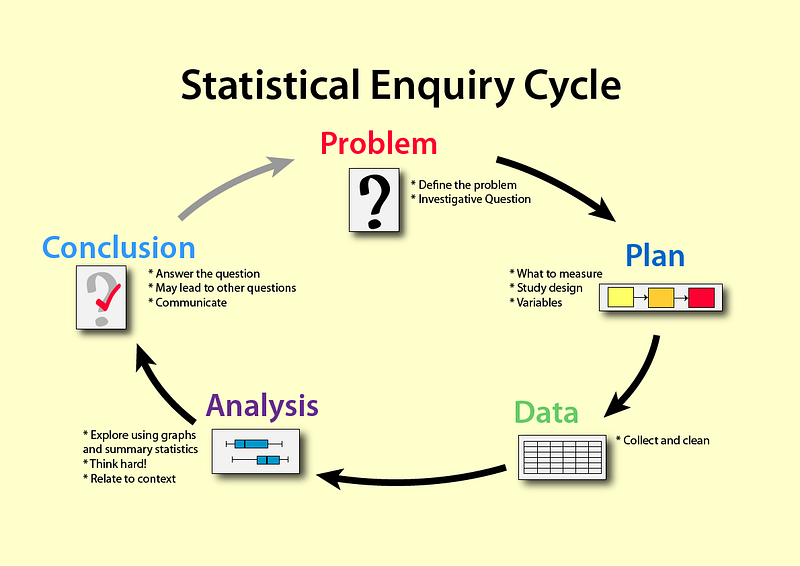
Take a brief look at this diagram, it shows the foundational PPDAC process:
It’s generalizable to business, but let me make it more specific for you.
The PPDAC Process in Business
Problem
- Define a business problem
- Convert it into a statistical question
Plan
- Design a study to answer the question
Data
- Collect data following the plan
Analysis
- Explore the data descriptively (also called Exploratory Data Analysis)
- Use statistical inference to analyze the data (models, tests, etc.)
Conclusion
- Draw conclusions
- Apply them to the business problem
3 Most Important Approaches in Business Statistics
Enough with the big picture, let’s get into the tangibles. To give you the most effective overview and highest value for your time, I’ll introduce 3 statistics approaches — at least as of 2022, this should be all you need to know about statistics to thrive in any non-technical career.
They are:
1. Regression
2. Time Series Modelling
3. Process Performance Control
As promised, I won’t use any formulas — and I’ll try to simplify concepts without losing their meaning as much as possible.
#1: Regression
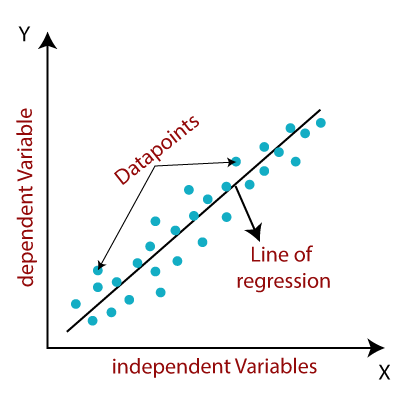
The goal of regression is to “draw a line” that’s close to as many of the data points as possible — that’s the line of regression, or line of best fit. It minimizes the total distance between all the points and the line (in a process called least squares estimation).
And this line is what we’re mostly concerned about — we look at its properties (we call parameters), and use them to test our guesses.
For example, we could do a regression using the area, the number of rooms, and age to predict the price of a house.
Regression will tell us how significant each of these factors is — how much they contribute to the value we’re predicting.

You might ask the question: Does it really matter how old my house is? My house is 20 years older than my neighbor’s, should I be concerned it won’t sell as much?
Regression Analysis (pulling things together)
- We make a hypothesis (ie. house age has no impact on house price)
- We find the line of best fit, typically using a computer program
- We use specific criteria to understand if the properties of the line of best fit are consistent with our hypothesis
- If they’re consistent, we accept the hypothesis until we find further evidence against it; if not, we reject the hypothesis
We typically want the hypothesis to be rejected — because that means we’re getting new information, and our question is answered excitingly.
Business applications: prioritizing decisions, understanding which factors impact revenues & expenses the most, pricing & valuation, and more.
#2: Time Series Modelling
In regression, our inputs can be pretty much anything, and you can use multiple inputs at the same time.

In time series, there’s only one “input”, time. We’re modeling the value of something over time to understand how it changes with time — like predicting sales, stock prices, and temperature.
The pattern of anything that changes with time can be broken down into three components — trend, seasonal, and random.
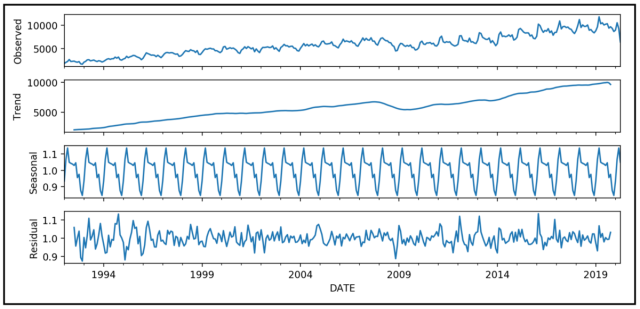
In the chart above, you see 4 graphs. The topmost one is the original data, and the three below break the graph down into separate parts — if you added the bottom three together, you’ll get the graph at the top. Pretty cool, right?
The essence of time series modelling is to address each component separately, and then add them up to make a good forecast of the future.

Let’s take the quarterly enrollments at your closest university, for example.
What’s the seasonal component? The pattern where enrollments are always higher in “school months” and much lower in summer months since only summer students enroll.
What’s the trend component? You might see an increase in students over the years because the population in your region is growing or the school is admitting more people.
And the rest? We call it random variation.
Then, we build a linear model (the same way as regression) to account for both the “seasonality” and the “trend” to predict future enrollments.
#3: Process Control
This approach is commonly used to control quality in production — if you’re in operations or supply chain roles, this is highly relevant to you.

First, what is a process? A process is a series of repeated actions aimed at producing a standard output each time — like making the small parts to build a car.
When we’re producing something, our biggest concern is: Does our output satisfy our standards? Is it acceptable to us?
There are two ways to do this.
First, we can use figure out “How many defects am I willing to accept given my standards?”, and compare that to the actual defect rate. This is done using capability ratios and probability techniques.
Second, we can monitor the quality of our outputs to make sure it stays consistent over time. And when it doesn’t, statistical control charts will signal to us that there’s a change — so we can fix it ASAP.
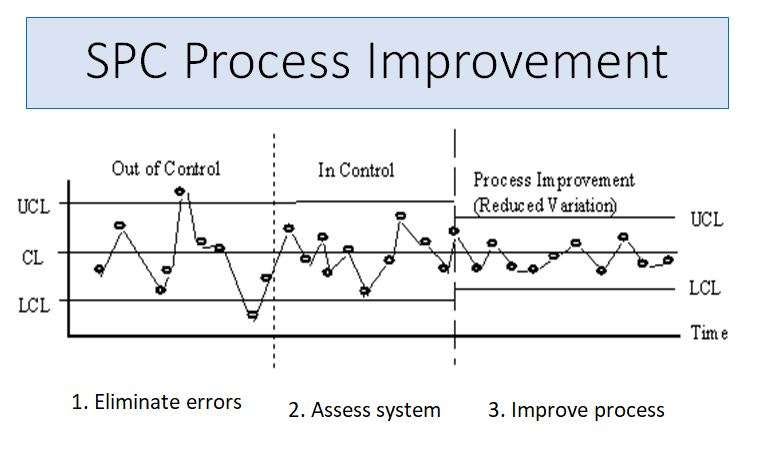
This is how we use statistics to control process performance.

If you’re here, you stook it through — and gained knowledge that will work for you from now on.
Quick recap of everything we talked about:
- Statistics can answer “what happened”, “why it happened”, “what will happen next”, and “what we should do” in business settings.
- The core statistical process and how it’s used in business: Problem, Plan, Data, Analysis, Conclusion.
- Understanding the 3 most important applications of statistics in business— regression, time series modeling, and process control.
If you enjoyed this read, you might benefit from my other business articles:
Thanks for letting me take part in your learning journey. Follow me so I can bring more valuable content to you, and until next time, take care :)