Multi-Touch Attribution Marketing Model - The Shapley value approach -part 1
Introduction
The filed of online advertising, media effective evaluation is an important part of the decision-making process. Since the cost of an advertisement is based on the number of clicks or impressions, it is very important to understand the media effectiveness of each action. Due to the different nature of each channel, it is necessary to understand the marketing effect of each channel. Therefore, in order to understand the impact of online marketing activities, a multi-channel attribution model must be considered.
Rule-Based Models
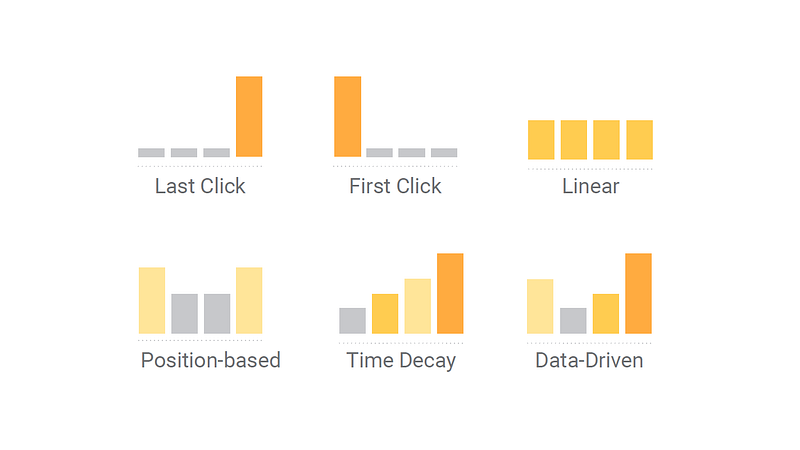
Common attribution analysis models include:
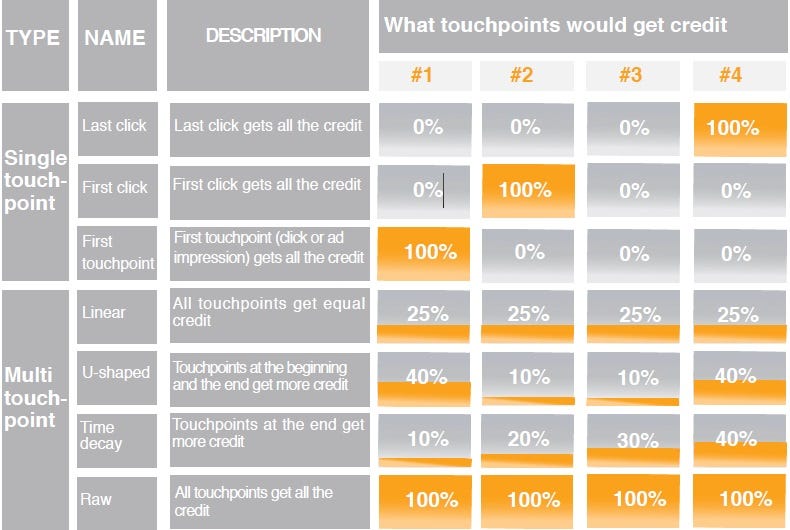
- Last click: the last touchpoint before the user purchases all contribution values
- First click: The first touchpoint on the user’s access path gets all contribution values
- Linear model: all touchpoints on the user’s access path equally share the contribution value
- Time decay model: the earlier touchpoints on the user’s access path get more contribution value
Rule-based VS. Algorithmic
Multi-Touch Attribution is a very popular marketing science technique in digital marketing. Traditional rule-based models like last-touch(click) model or position-based model, have rooted biases that make them ineffective.
The more marketing channels and more complex customer behavior paths, the more insightful attribution models are needed to help determine channel value, optimize channel mix, and resource allocation. A subtle channel difference may help companies win in market competition.
So, what’s the deal of multi-touch attribution marketing model? Fortunately, the data-driven attribution model can detect channel changes and adjust channel weight values, so it will be more accurate in most cases.
There are several data-driven models have been proposed based on different mathematical theories: Markov models, game theory models, Survival Analysis models, etc. In this post, we will only go over the game theory model and the Shapley value. The Shapley Value was also applied as an approach to the Google Analytics Data-Driven Attribution model.
Cooperative Games and the Shapley value
The Shapley Value was developed by the economics Nobel Laureate Lloyd S. Shapley as an approach to fairly distributing the output of a team among the constituent team members.
In game theory, the Shapley value is a solution concept of fairly distributing both gains and costs to several actors working in coalition. The Shapley value applies primarily in situations when the contributions of each actor are unequal, but they work in cooperation with each other to obtain the payoff.

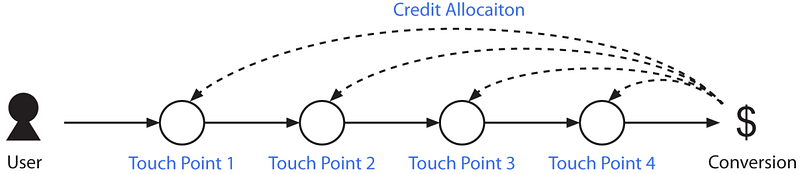
Marketing channels are the players in the cooperative game and each of them can be thought of as working together in order to drive conversions. In other words, this approach fairly assigns each touchpoint contribution to the conversion.
Before we start, I would like to introduce serval key concepts we will use in the later calculation. Notice that I define characteristic function simply as the sum of conversions that the coalition generated.
- N = Channels{House ads, Facebook, Email, Google, etc.} It is a set of players
- S = Coalition, the subset of players, the channels worked together where formed the coalitions.
- |𝑆| is the cardinality of coalition 𝑆 and the sum extends over all subsets 𝑆 of n not containing channel i.
- n = Number of N
- v(S) = A real-valued function v, called the characteristic function. The contribution of S which denotes a coalition of N (channels). It is the weight of each channel after calculation.
- Weight = |S|!(n-|S|-1)!/n!
- Marginal contribution = v(S U {i})-v(S) Incremental weighted sum minus the coalition without v(S)
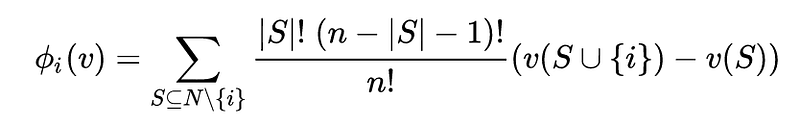
As the purpose of this post, I am not going to confuse you to explain holistic methodology to show the proof here. See here for proof. But you need to know the basic idea of Shapley value method is that it takes the weighted average of its marginal contribution over all possible coalitions for each channel.
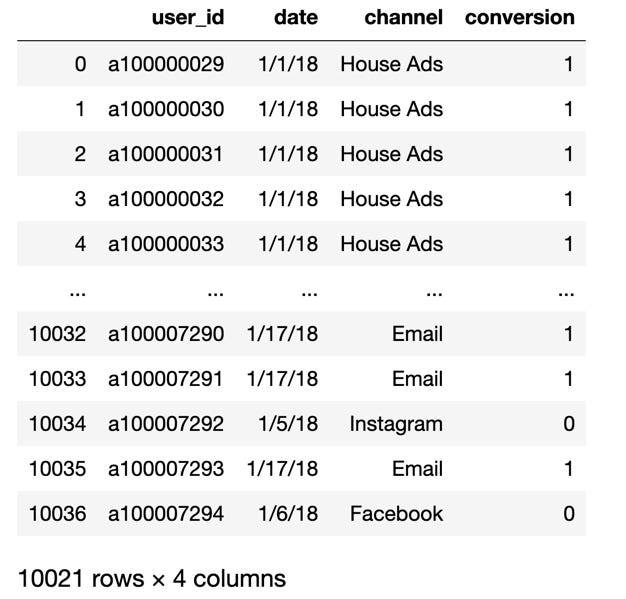
We will use a sample marketing dataset here from Kaggle.
After we download the data we will need to do some manipulation. We only need four variables here: user_id, date, channel, conversion. Please label the conversion to 1 otherwise to 0. And drop the Null data.
Here is the Python code for your reference.
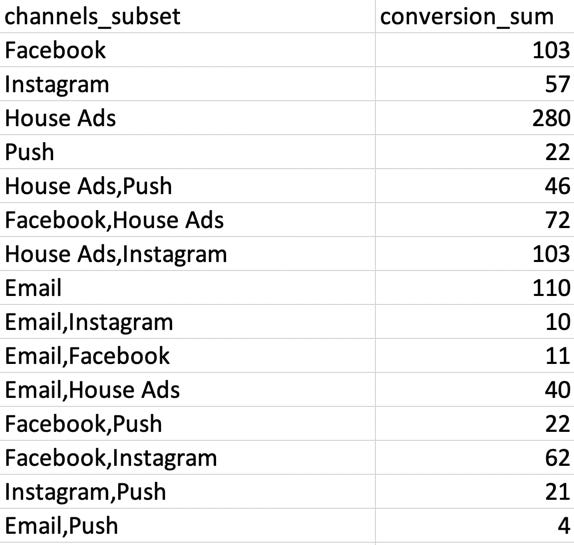
The next step, we would like to get the channel subset, S, the coalitions and the sum of their conversions.
MySQL code for reference
SELECT channels_subset, sum(b.conversion) as conversion_sum
FROM(
SELECT user_id, GROUP_CONCAT(DISTINCT(channel)) as channels_subset, max(conversion) as conversion
FROM(
SELECT user_id,channel,conversion
FROM demo.simulated_data
ORDER BY user_id,channel
) a
GROUP BY user_id)
b
GROUP BY channels_subset;
Then we will use Python to calculate the weight and Marginal contribution.
First, we will need to import the modules in Python
import pandas as pd
import itertools
from collections import defaultdict
from itertools import permutations,combinations
import numpy as np
Create a function that returns all possible combination of the channel
def power_set(List):
    PS = [list(j) for i in range(len(List)) for j in itertools.combinations(List, i+1)]
    return PS
Return all the possible subsets of a set of channels
def subsets(s):
    '''
    This function returns all the possible subsets of a set of channels.
    input :
            - s: a set of channels.
    '''
    if len(s)==1:
        return s
    else:
        sub_channels=[]
        for i in range(1,len(s)+1):
            sub_channels.extend(map(list,itertools.combinations(s, i)))
    return list(map(",".join,map(sorted,sub_channels)))
Computes the worth of each coalition.
def v_function(A,C_values):
    '''
    This function computes the worth of each coalition.
    inputs:
            - A : a coalition of channels.
            - C_values : A dictionnary containing the number of conversions that each subset of channels has yielded.
    '''
    subsets_of_A = subsets(A)
    #print(subsets_of_A)
    #exit()
    worth_of_A=0
    for subset in subsets_of_A:
        #print("subset:", subset)
        if subset in C_values:
            #print("subset:", subset, "; Value:", C_values[subset])
            worth_of_A += C_values[subset]
    return worth_of_A
Calculate the factorial of a number (a non-negative integer)
def factorial(n):
    if n == 0:
        return 1
    else:
        return n * factorial(n-1)
Final code here
def calculate_shapley(df, col_name):
    '''
    This function returns the shapley values
            - df: A dataframe with the two columns: ['channels_subset', 'conversion_sum'].
            The channel_subset column is the channel(s) associated with the conversion and the count is the sum of the conversions.
            - col_name: A string that is the name of the column with conversions
            **Make sure that that each value in channel_subset is in alphabetical order. Email,PPC and PPC,Email are the same
            in regards to this analysis and should be combined under Email,PPC.
            ***Be careful with the distinct number of channels because this can signifcantly slow the perfomance of this function.
            Remember the total possible combinations of channels is 2^(n) where n is the number of channels. If you have 30 channels
            this is 1,073,741,824 combinations.

    '''
    c_values = df.set_index("channels_subset").to_dict()[col_name]
    df['channels'] = df['channels_subset'].apply(lambda x: x if len(x.split(",")) == 1 else np.nan)
    channels = list(df['channels'].dropna().unique())

    v_values = {}
    for A in power_set(channels):
        v_values[','.join(sorted(A))] = v_function(A,c_values)
    #print(v_values)
    n=len(channels)
    shapley_values = defaultdict(int)
for channel in channels:
for A in v_values.keys():
#print(A)
if channel not in A.split(","):
#print(channel)
cardinal_A=len(A.split(","))
A_with_channel = A.split(",")
A_with_channel.append(channel)
A_with_channel=",".join(sorted(A_with_channel))
# Weight = |S|!(n-|S|-1)!/n!
weight = (factorial(cardinal_A)*factorial(n-cardinal_A-1)/factorial(n))
# Marginal contribution = v(S U {i})-v(S)
contrib = (v_values[A_with_channel]-v_values[A])
shapley_values[channel] += weight * contrib
# Add the term corresponding to the empty set
shapley_values[channel]+= v_values[channel]/n
return shapley_valuesThe sample data that we used in this post, we got the results below
defaultdict(int,
            {'Facebook': 198.50000000000003,
             'Instagram': 168.0,
             'House Ads': 427.83333333333337,
             'Push': 74.16666666666669,
             'Email': 146.5})
We can finally visualize it.
#visualizations
import matplotlib.pyplot as plt
from pandas.plotting import scatter_matrix
%matplotlib inline
import seaborn as sns
result = DataFrame(list(dict(calculate_shapley(data, "conversion_sum")).items()),columns = ['Channel','Contributions'])# Visualization
plt.subplots(figsize=(18, 6))
sns.barplot(x='Channel', y='Contributions', data=result)
plt.show()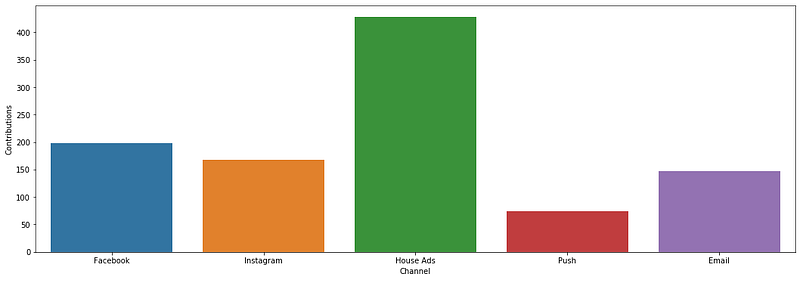
Have a try by yourself!
Conclusion
In this post, we walk through how to use the raw data to create a data-driven attribution model. The real-world data be even more complicated, but at least you get the idea of how it works.
I am also planning to write another post about the Markov Chain method to multi-touch attribution model using R and Python. Stay tuned!
All right, let me know what your thoughts below. If you like this post, please hit the claps button below, and don’t forget to share it to social media.
Reference:


