
The Secret Sauce of Trading — My Top Technical Indicators Revealed
Presenting my Dream Team of Technical Indicators
In the world of trading and investing, having a well-defined strategy is crucial for success. Many traders rely on technical indicators to make informed decisions about buying and selling assets. With numerous technical indicators to choose from, it can be challenging to determine which ones are the most effective for your trading style.
This article aims to simplify the process by presenting a selection of my top technical indicators. These indicators have consistently helped me make better trading decisions and navigate the often turbulent waters of the financial markets. Whether you’re a beginner looking to build a solid foundation or an experienced trader seeking to refine your approach, the indicators discussed here can offer valuable insights and practical applications.
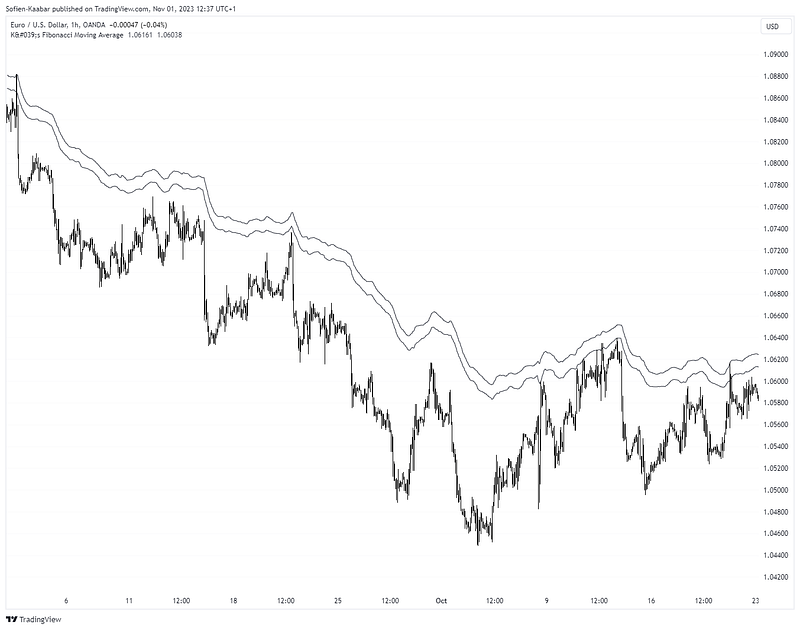
K’s Fibonacci Moving Average
A moving average is a statistical calculation used to analyze data over a specific time period by averaging values within that period. It smooths out fluctuations in the data, making trends and patterns more apparent. There are various types of moving averages, such as the simple moving average (SMA) and exponential moving average (EMA), each with its own way of calculating the average based on historical data points. The Fibonacci moving average (FMA) uses a special combination of moving averages with lookback periods corresponding to the Fibonacci sequence to combine the long-term dependencies with the short-term fluctuations.
Its main aim is to provide a support and a resistance zone depending on its position relative to the current market price.
The following chart shows the FMA as support as it accompanies the market in its bullish phase. The main use of it is to buy the dips.
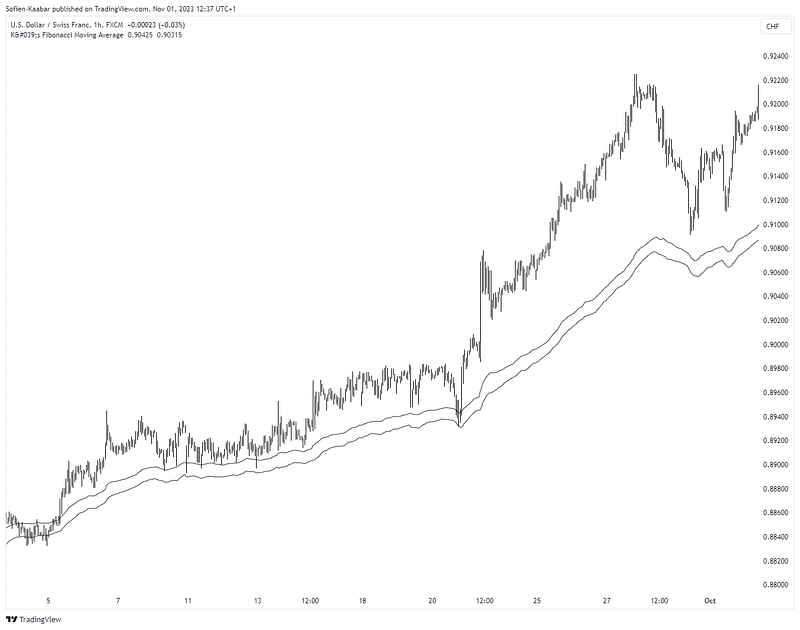
Theoretically, the market is expected to hold when it enters the zone from the above.
The following chart shows the FMA as resistance as it accompanies the market in its bearish phase. The main use of it is to sell the strengths.
The FMA works well in trending markets and a little less in ranging markets.
Financial pattern recognition is no easy task, and the best way to dip your toes in this field is through candlestick pattern recognition. Learn how to detect classic and modern patterns using Python in my book published with O’Reilly Media! A dedicated GitHub is provided.
K’s Extreme Duration
The extreme duration technique uses a few conditions on the RSI and the price action to deliver a type of confirmed reversal.
The following chart shows the different signals generated by the extreme duration technique.
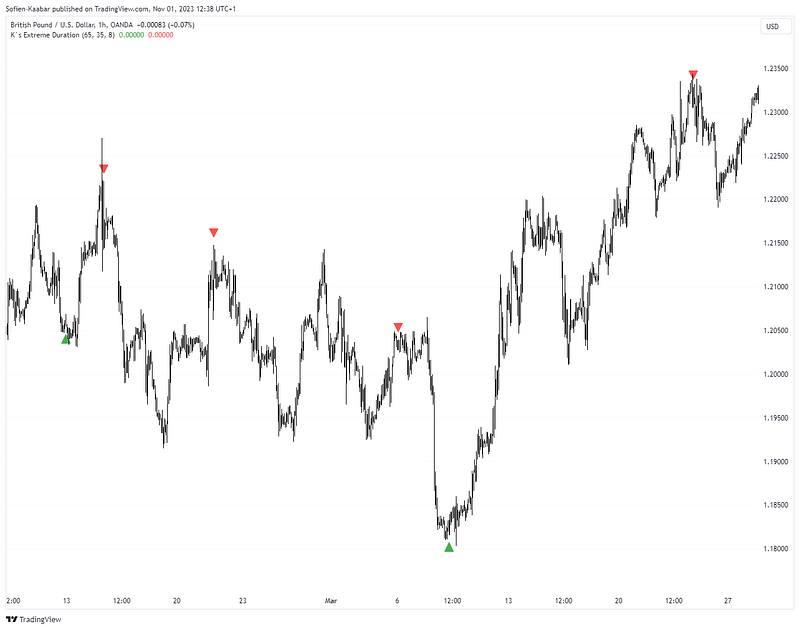
The strength of K’s extreme duration lies in ranging markets. It outperforms many indicators in detecting accurate reversals. Naturally, this also means that it underperforms in trending markets.
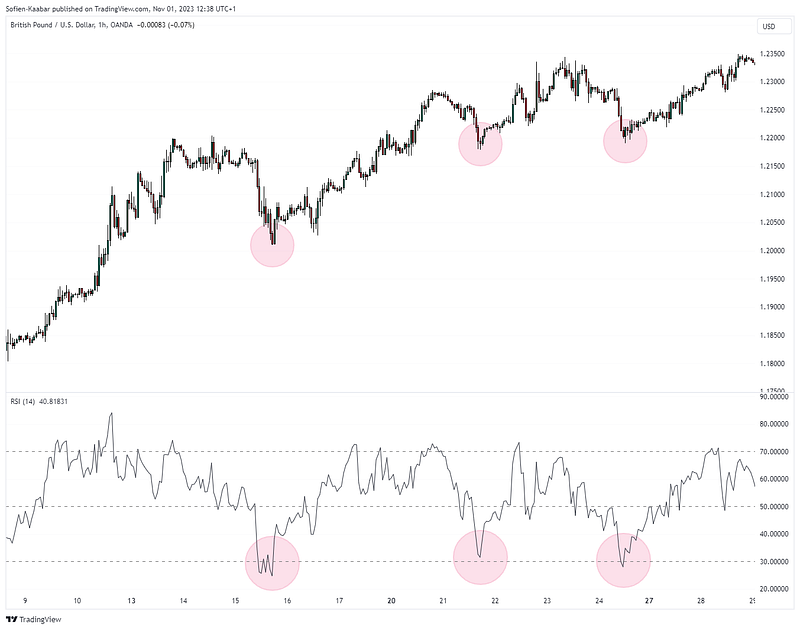
The Relative Strength Index
The relative strength index (RSI), and it’s a momentum oscillator used in technical analysis to assess the speed and change of price movements in financial markets, typically in stocks or commodities. RSI is calculated based on the ratio of recent upward price movements to recent downward price movements. It provides a numerical value that ranges from 0 to 100 and is used to identify overbought or oversold conditions in an asset. A high RSI value (typically above 70) may indicate that an asset is overbought and due for a price correction, while a low RSI value (typically below 30) may suggest that it’s oversold and could see a potential rebound in price.
The following chart shows the bullish signals generated from the RSI.
The following chart shows the bearish signals generated from the RSI.
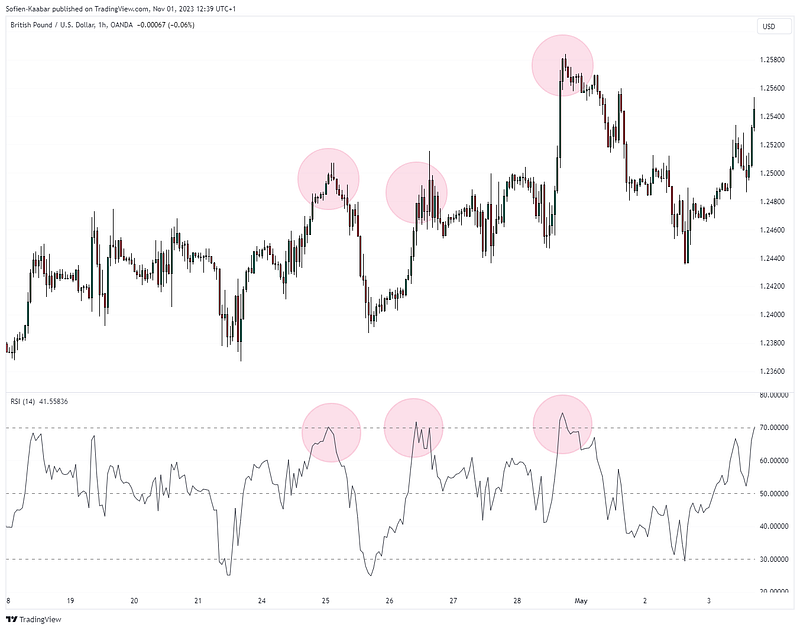
Notice how the bearish signals are weaker than the bullish signals when you compare both charts. This is intentional and it is to show you the difference between having the trend on your side and having it against you.
K’s Reversal Indicator I
This indicator combines two famous technical indicators in a harmonius way to deliver a reversal signal. The two indicators are MACD and Bollinger bands.
The following chart shows the different signals generated by K’s reversal indicator I.
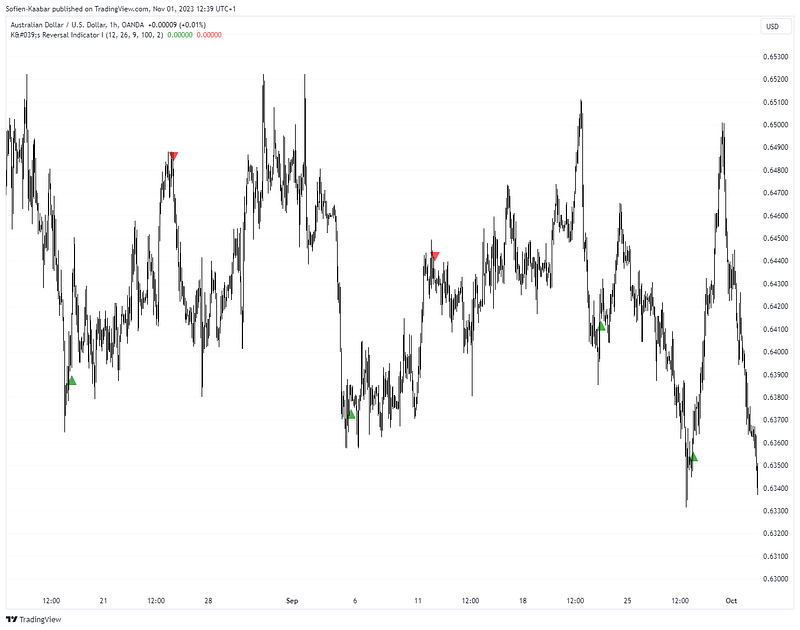
As this is a reversal indicator, make sure to use it in ranging markets. Trading strategies based on this indicator must optimize entries and exits as you wish in order to tweak the performance.
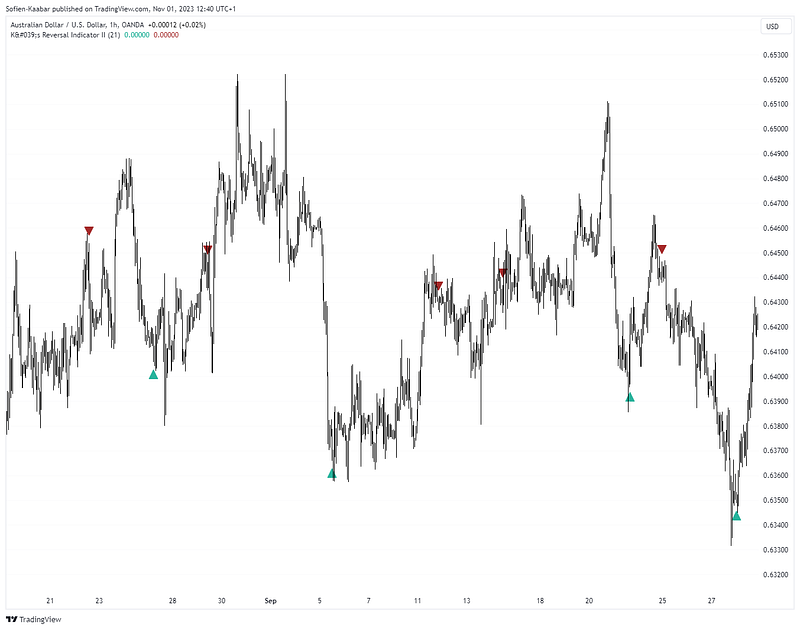
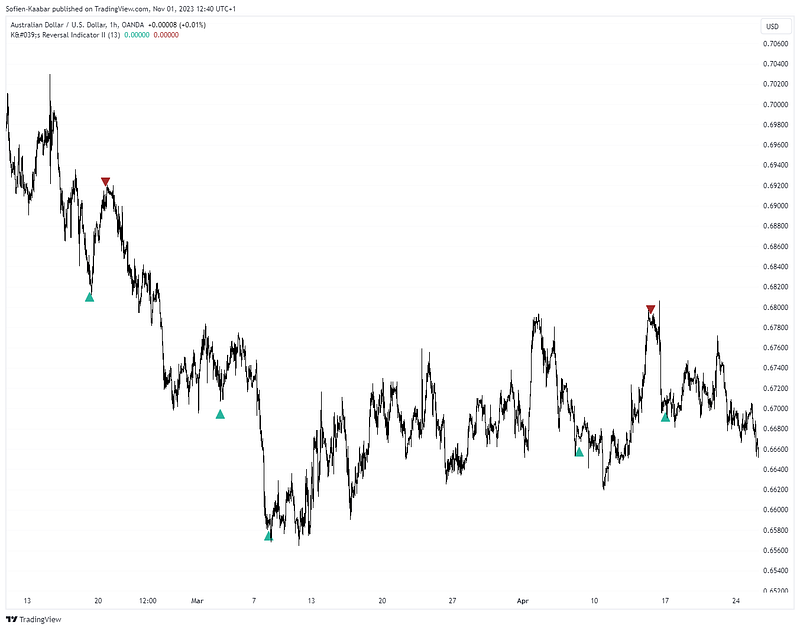
K’s Reversal Indicator II
The second indicator in the K’s reversal indicators collection is this powerful and flexible mix of moving averages and distance calculations. K’s reversal indicator II is supposed to be an enhanced version of K’s reversal indicator I but with more signals. However, it developed into an indicator of its own with its unique DNA. There are two versions of K’s reversal indicator II, the agressive form and the conservative form.
The following chart shows the different signals generated by K’s reversal indicator II using its aggressive form (which simply uses 21-period lookback period).
The following chart shows the different signals generated by K’s reversal indicator II using its conservative form (which simply uses 13-period lookback period).
To sum up, choosing technical indicators for your trading is a delicate task that must use proper research and deep understanding of the weaknesses and the advantages. I highly recommend you back-test any indicator you are interested in before adding it to your framework.