
The Schaff Trend Cycle
Developing the Schaff Trend Cycle Indicator in Python to Trade the Trend

There are two desired outcomes of a trend-following strategy, the first one is entering on time and the second one is exiting on time. We always seek to detect the changes of trends as early as possible and then want to exit after having exploited most of it. This is easier said than done and many indicators are lagging. In this article we will discuss a supposedly slightly less lagging version of an indicator that resembles the MACD.
I have released a new book called “Contrarian Trading Strategies in Python”. It features a lot of advanced contrarian indicators and strategies with a GitHub page dedicated to the continuously updated code. If you are interested, you could buy the PDF version directly through a PayPal payment of 9.99 EUR.
Please include your email in the note before paying so that you receive it on the right address. Also, once you receive it, make sure to download it through google drive.
The Concept of Moving Averages
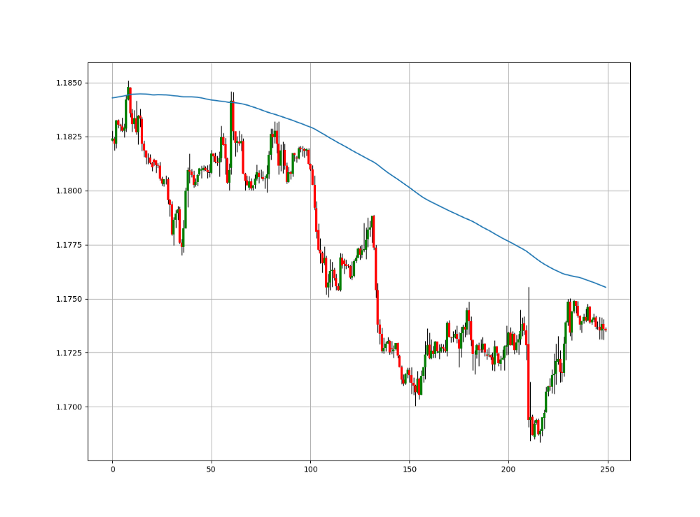
Moving averages help us confirm and ride the trend. They are the most known technical indicator and this is because of their simplicity and their proven track record of adding value to the analyses. We can use them to find support and resistance levels, stops and targets, and to understand the underlying trend. This versatility makes them an indispensable tool in our trading arsenal.
As the name suggests, this is your plain simple mean that is used everywhere in statistics and basically any other part in our lives. It is simply the total values of the observations divided by the number of observations. Mathematically speaking, it can be written down as:
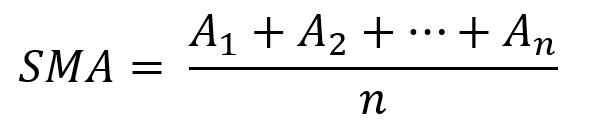
We can see that the moving average is providing decent dynamic support and resistance levels from where we can place our orders in case the market goes down there. The code for the moving average can be written down as the following:
# The function to add a number of columns inside an array
def adder(Data, times):

    for i in range(1, times + 1):

        new_col = np.zeros((len(Data), 1), dtype = float)
        Data = np.append(Data, new_col, axis = 1)

    return Data
# The function to delete a number of columns starting from an index
def deleter(Data, index, times):
for i in range(1, times + 1):
Data = np.delete(Data, index, axis = 1)
return Data
# The function to delete a number of rows from the beginning
def jump(Data, jump):
Data = Data[jump:, ]
return Data# Example of adding 3 empty columns to an array
my_ohlc_array = adder(my_ohlc_array, 3)# Example of deleting the 2 columns after the column indexed at 3
my_ohlc_array = deleter(my_ohlc_array, 3, 2)# Example of deleting the first 20 rows
my_ohlc_array = jump(my_ohlc_array, 20)# Remember, OHLC is an abbreviation of Open, High, Low, and Close and it refers to the standard historical data filedef ma(data, lookback, close, where):
data = adder(data, 1)
for i in range(len(data)):
try:
data[i, where] = (data[i - lookback + 1:i + 1, close].mean())
except IndexError:
pass
data = jump(data, lookback)
return dataThe below states that the moving average function will be called on the array named my_data for a lookback period of 200, on the column indexed at 3 (closing prices in an OHLC array). The moving average values will then be put in the column indexed at 4 which is the one we have added using the adder function.
my_data = ma(my_data, 200, 3, 4)Check out my weekly market sentiment report to understand the current positioning and to estimate the future direction of several major markets through complex and simple models working side by side. Find out more about the report through this link:
The MACD
The MACD is probably the second most known oscillator after the RSI. One that is heavily followed by traders. It stands for moving average convergence divergence and it is used mainly for divergences and flips. Many people also consider it a trend-following indicator but others use graphical analysis on it to find reversal points, making the MACD a versatile indicator.
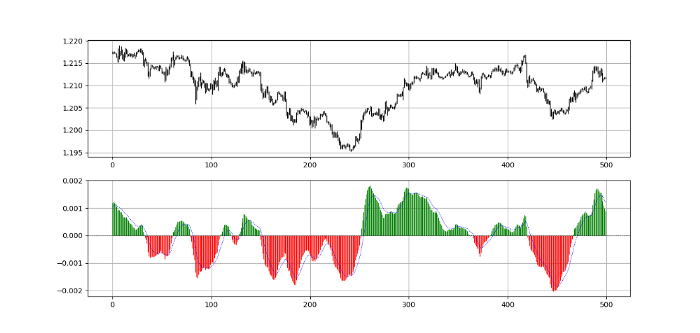
How is the MACD calculated? It is the difference between the 26-period exponential moving average applied to the closing price and the 12-period exponential moving average also applied to the closing price. The value found after taking the difference is called the MACD line. The 9-period exponential moving average of that calculation is called the MACD signal.
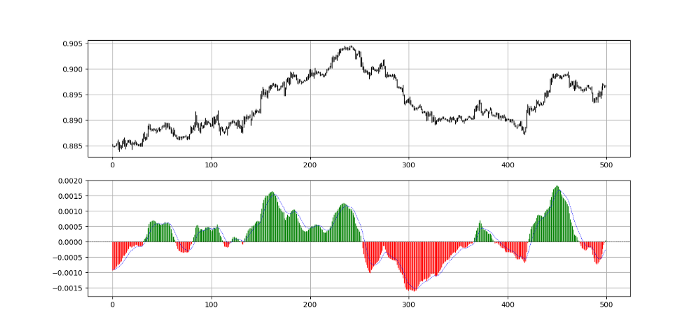
As a reminder, the MACD line is the difference between the two exponential moving averages which is plotted as histograms in green and red. The MACD signal is simply the 9-period exponential moving average of the MACD line.
The Schaff Trend Cycle
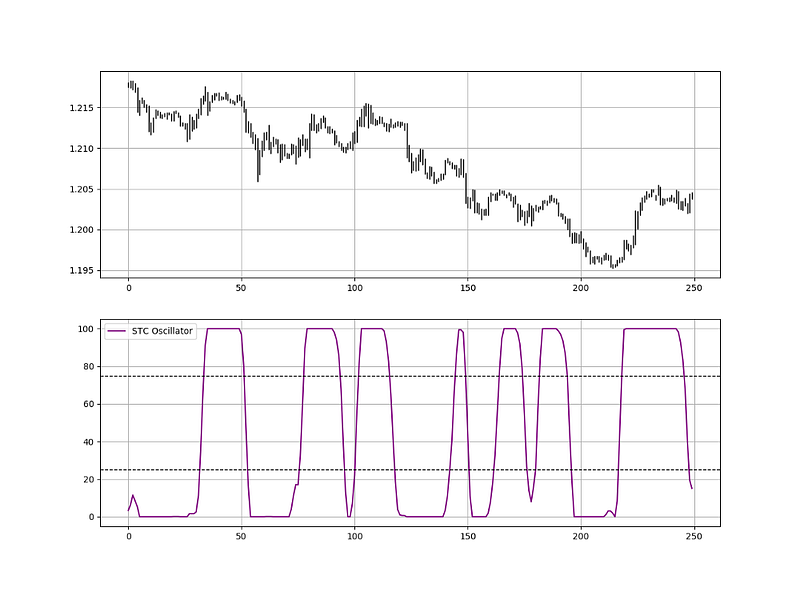
Created by Doug Schaff, the idea of the indicator is that FX pairs accelerate and decelerate in cycles. It is used through what we call a barrier exit. As the Schaff Trend Cycle is bounded between 0 and 100, when it surpasses 25, a bullish signal is given and when it breaks 75, a bearish signal is given.
The indicator is composed of a MACD using a 23 and a 50-period exponential moving averages (thus, the difference between the two) and a 10-period normalization applied to the MACD values.
But you do not need to burden yourself with the calculation, as they are not universally clear, the formulas presented elsewhere in the sources I have found are not really possible as they would entail a lot of infinite values. Therefore, I provided a simple fix that is incorporated in the function below.
We can code the Schaff Trend Cycle in the following manner on OHLC data array with a few columns to spare:
def stc(Data, st_ema, lt_ema, stoch_lookback, what, where):

    Data = ema(Data, 2, st_ema, what, where)
    Data = ema(Data, 2, lt_ema, what, where + 1)

    # MACD Line
    Data[:, where + 2] = Data[:, where] - Data[:, where + 1]
# %K
for i in range(len(Data)):
try:
Data[i, where + 3] = 100 * (Data[i, where + 2] - min(Data[i - stoch_lookback + 1:i + 1, where + 2])) / (max(Data[i - stoch_lookback + 1:i + 1, where + 2]) - min(Data[i - stoch_lookback + 1:i + 1, where + 2]))
except ValueError:
pass
# %D
Data = ma(Data, 3, where + 3, where + 4)
return Data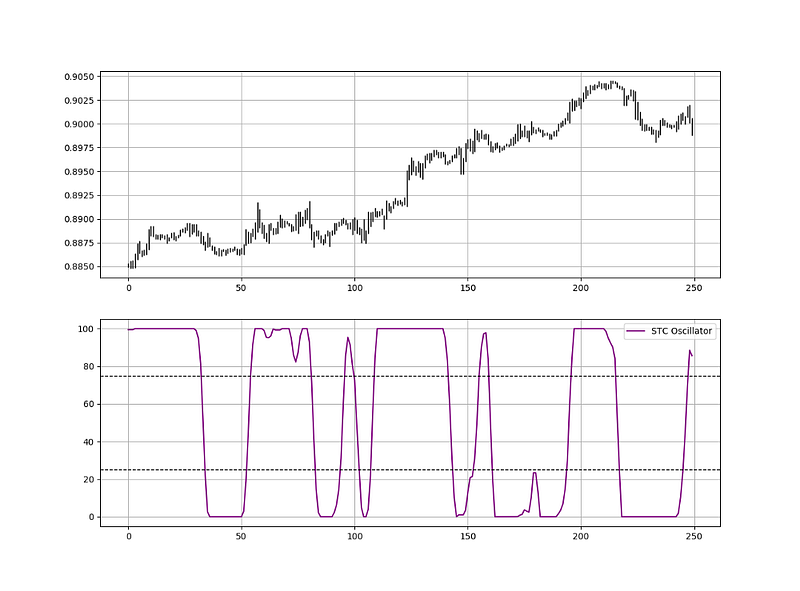
The Schaff Trend Cycle is also referred to as the STC.
The STC is used as follows:
- A long (Buy) signal is generated whenever the STC surpasses the 25 line, thus confirming the bullish trend.
- A short (Sell) signal is generated whenever the STC breaks the 75 line, thus confirming the bearish trend.
I have recently partnered with Lumiwealth, and if you want to see how to create all sorts of algorithms yourself, feel free to check out the below link. From algorithmic trading to blockchain and machine learning, they have hands-on detailed courses that I highly recommend.
Summary
To sum up, what I am trying to do is to simply contribute to the world of objective technical analysis which is promoting more transparent techniques and strategies that need to be back-tested before being implemented. This way, technical analysis will get rid of the bad reputation of being subjective and scientifically unfounded.
Medium is a hub to interesting reads. I read a lot of articles before I decided to start writing. Consider joining Medium using my referral link (at NO additional cost to you).
I recommend you always follow the the below steps whenever you come across a trading technique or strategy:
- Have a critical mindset and get rid of any emotions.
- Back-test it using real life simulation and conditions.
- If you find potential, try optimizing it and running a forward test.
- Always include transaction costs and any slippage simulation in your tests.
- Always include risk management and position sizing in your tests.
Finally, even after making sure of the above, stay careful and monitor the strategy because market dynamics may shift and make the strategy unprofitable.
For the paperback link of the book, you may use the following link: