
The Reversal Indicator — Coding in Python.
Coding the Rob Booker Reversal Indicator in Python.

Some less-known indicator actually function pretty well. Among those indicator is Rob Booker’s Reversal Indicator which uses a special combination between the MACD oscillator and the Stochastic oscillator. This article discusses creating the indicator in Python. All credits go to Rob Booker.
I have just released a new book after the success of my previous one “Trend Following Strategies in Python”. It features advanced contrarian indicators and strategies with a GitHub page dedicated to the continuously updated code. Also, this book features the original colors after having optimized for printing costs. If you feel that this interests you, feel free to visit the below Amazon link, or if you prefer to buy the PDF version, you could check the link at the end of the article.
The MACD Oscillator
The MACD is probably the second most known oscillator after the RSI. One that is heavily followed by traders. It stands for Moving Average Convergence Divergence and it is used mainly for divergences and flips. Many people also consider it a trend-following indicator but others use graphical analysis on it to find reversal points, making the MACD a versatile indicator.
How is the MACD calculated? It is the difference between the 26-period Exponential Moving Average applied to the closing price and the 12-period Exponential Moving Average also applied to the closing price. The value found after taking the difference is called the MACD line. The 9-period Exponential Moving Average of that calculation is called the MACD signal.
# The function to add a number of columns inside an array
def adder(Data, times):

    for i in range(1, times + 1):

        new_col = np.zeros((len(Data), 1), dtype = float)
        Data = np.append(Data, new_col, axis = 1)

    return Data
# The function to delete a number of columns starting from an index
def deleter(Data, index, times):
for i in range(1, times + 1):
Data = np.delete(Data, index, axis = 1)
return Data
# The function to delete a number of rows from the beginning
def jump(Data, jump):
Data = Data[jump:, ]
return Data# Example of adding 3 empty columns to an array
my_ohlc_array = adder(my_ohlc_array, 3)# Example of deleting the 2 columns after the column indexed at 3
my_ohlc_array = deleter(my_ohlc_array, 3, 2)# Example of deleting the first 20 rows
my_ohlc_array = jump(my_ohlc_array, 20)# Remember, OHLC is an abbreviation of Open, High, Low, and Close and it refers to the standard historical data filedef ma(Data, lookback, close, where):
Data = adder(Data, 1)
for i in range(len(Data)):
try:
Data[i, where] = (Data[i - lookback + 1:i + 1, close].mean())
except IndexError:
pass
# Cleaning
Data = jump(Data, lookback)
return Datadef ema(Data, alpha, lookback, what, where):
alpha = alpha / (lookback + 1.0)
beta = 1 - alpha
# First value is a simple SMA
Data = ma(Data, lookback, what, where)
# Calculating first EMA
Data[lookback + 1, where] = (Data[lookback + 1, what] * alpha) + (Data[lookback, where] * beta)# Calculating the rest of EMA
for i in range(lookback + 2, len(Data)):
try:
Data[i, where] = (Data[i, what] * alpha) + (Data[i - 1, where] * beta)
except IndexError:
pass
return Datadef macd(Data, what, long_ema, short_ema, signal_ema, where):
Data = adder(Data, 1)
Data = ema(Data, 2, long_ema, what, where)
Data = ema(Data, 2, short_ema, what, where + 1)
Data[:, where + 2] = Data[:, where + 1] - Data[:, where]Data = jump(Data, long_ema)
Data = ema(Data, 2, signal_ema, where + 2, where + 3)
Data = deleter(Data, where, 2)
Data = jump(Data, signal_ema)
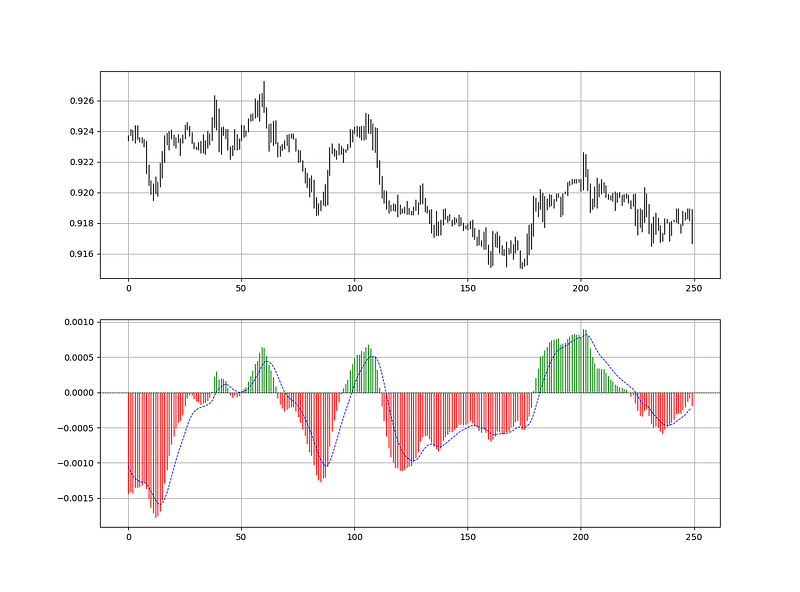
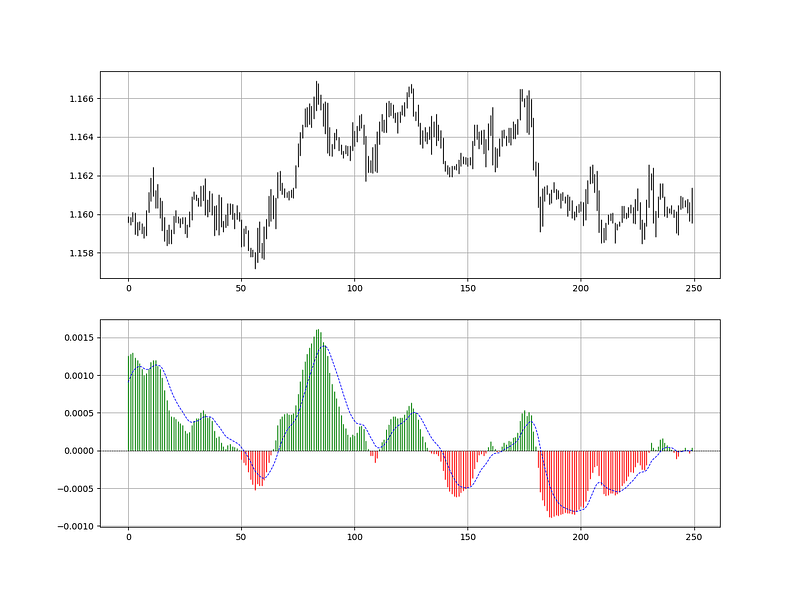
return DataAs a reminder, the MACD line is the difference between the two exponential moving averages which is plotted as histograms in green and red. The MACD signal is simply the 9-period exponential moving average of the MACD line.
The Stochastic Oscillator
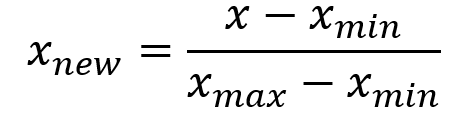
The first concept to understand with the Stochastic Oscillator is normalization. This technique allows us to trap values between 0 and 1 (or 0 and 100 if we wish to multiply by 100). The concept revolves around subtracting the minimum value in a certain lookback period from the current value and dividing by the maximum value in the same lookback period minus the minimum value (the same in the nominator).
The Stochastic Oscillator seeks to find oversold and overbought zones by incorporating the highs and lows using the normalization formula as shown below:
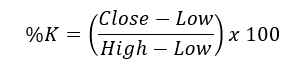
An overbought level is an area where the market is perceived to be extremely bullish and is bound to consolidate. An oversold level is an area where market is perceived to be extremely bearish and is bound to bounce. Hence, the Stochastic Oscillator is a contrarian indicator that seeks to signal reactions of extreme movements. We will create the below function that calculates the Stochastic on an OHLC data:
def stochastic(Data, lookback, high, low, close, where, genre = 'High-Low'):

    # Adding a column
    Data = adder(Data, 1)

    if genre == 'High-Low':

        for i in range(len(Data)):

            try:
                Data[i, where] = (Data[i, close] - min(Data[i - lookback + 1:i + 1, low])) / (max(Data[i - lookback + 1:i + 1, high]) - min(Data[i - lookback + 1:i + 1, low]))

            except ValueError:
                pass

    if genre == 'Normalization':

        for i in range(len(Data)):

            try:
                Data[i, where] = (Data[i, close] - min(Data[i - lookback + 1:i + 1, close])) / (max(Data[i - lookback + 1:i + 1, close]) - min(Data[i - lookback + 1:i + 1, close]))

            except ValueError:
                pass

    Data[:, where] = Data[:, where] * 100
    Data = jump(Data, lookback)
return Data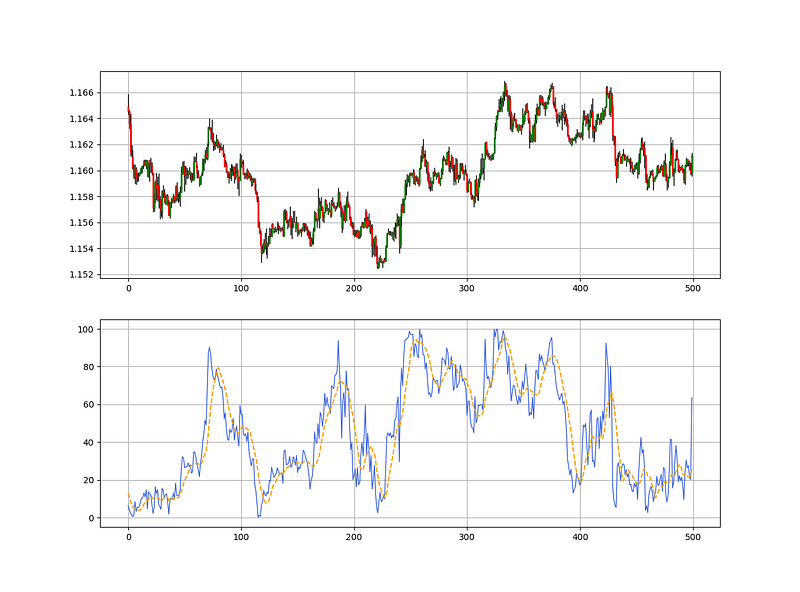
The above plot shows the EURUSD values plotted with a 70-period Stochastic Oscillator. Notice that the indicator will always be bounded between 0 and 100 due to the nature of its normalization function that traps values between the minimum and the maximum.
If you are also interested by trend following strategies and indicators, then my other book might interest you:
Creating the Rob Booker Reversal Indicator
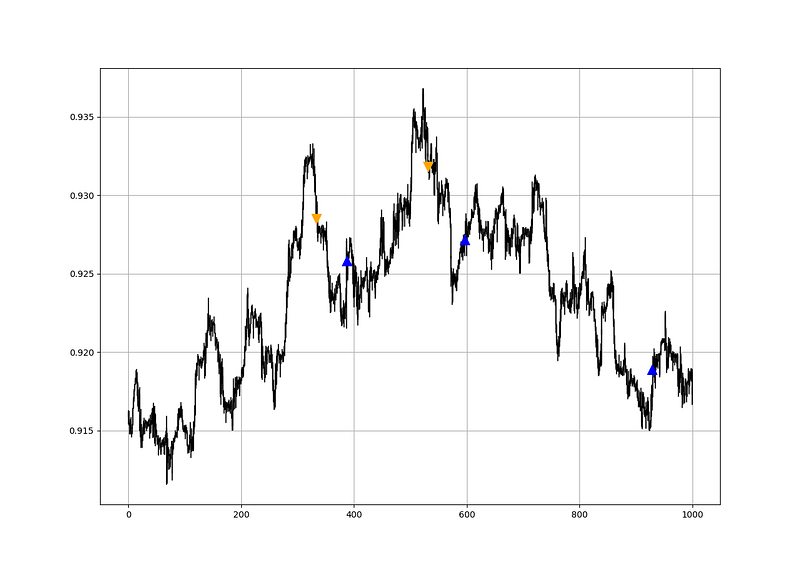
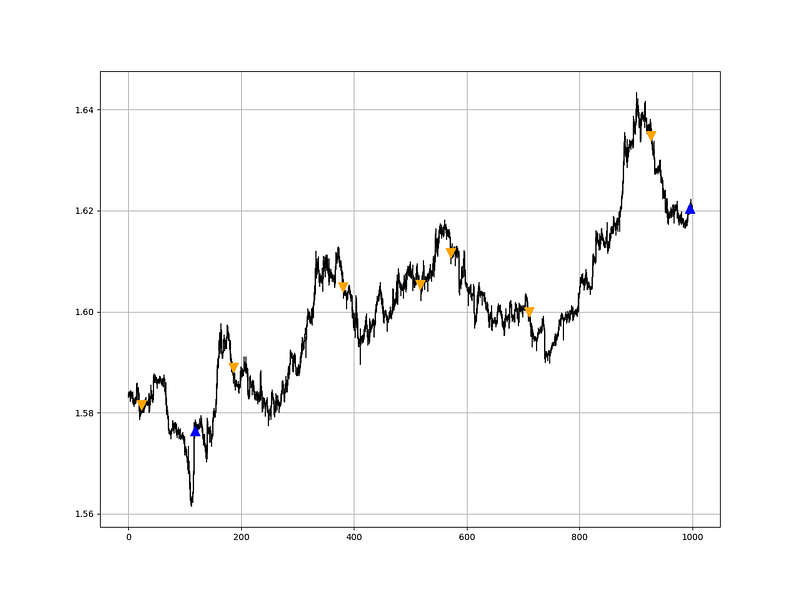
The reversal indicator is an overlay indicator based on arrows created following some rules on the MACD and the Stochastic oscillators:
- For a long (Buy) reversal signal, the MACD oscillator with its default parameters must surpass the zero line while the 10-period simple moving average of the 70-period Stochastic oscillator is below the lower barrier 30.
- For a short (Sell) reversal signal, the MACD oscillator with its default parameters must break the zero line while the 10-period simple moving average of the 70-period Stochastic oscillator is above the upper barrier 70.
# Setting parameters
stoch_lookback = 70
lower_barrier  = 30
upper_barrier  = 70
# Calling the 70-period Stochastic oscillator
my_data = stochastic(my_data, stoch_lookback, 1, 2, 3, 4)# Calling the 10-period moving average on the Stochastic values
my_data = ma(my_data, 10, 4, 5)# Calling the MACD function
my_data = macd(my_data, 3, 26, 12, 9, 6)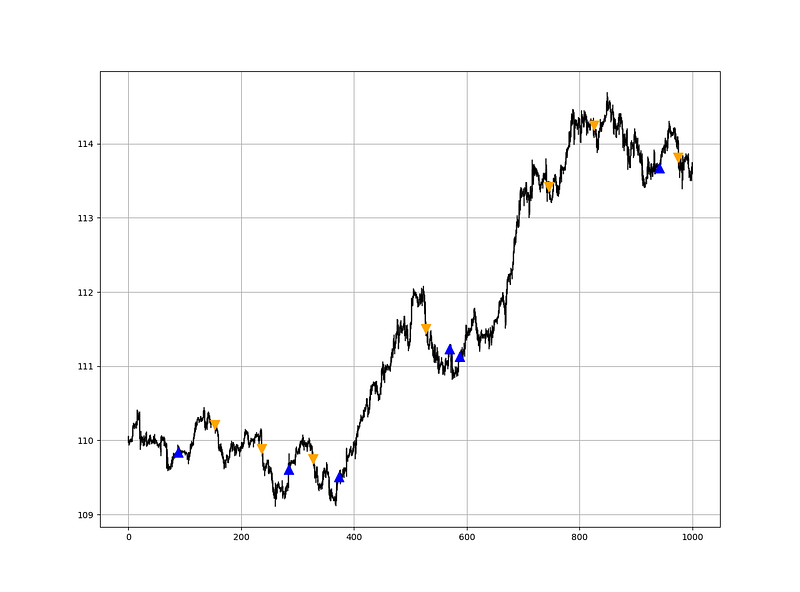
def signal(Data, stoch_col, macd_col, buy, sell):

    Data = adder(Data, 10)

    for i in range(len(Data)):

        if Data[i, macd_col] > 0 and Data[i - 1, macd_col] < 0 and Data[i, stoch_col] < lower_barrier:

               Data[i, buy] = 1

        elif Data[i, macd_col] < 0 and Data[i - 1, macd_col] > 0 and Data[i, stoch_col] > upper_barrier:

               Data[i, sell] = -1

    return Data
The indicator can be found in some charting platforms which is already a recognition that it is accepted among the trading community. However, it is not recommended to use it alone due to its lagging nature.
Summary
To summarize up, what I am trying to do is to simply contribute to the world of objective technical analysis which is promoting more transparent techniques and strategies that need to be back-tested before being implemented. This way, technical analysis will get rid of the bad reputation of being a subjective and scientifically unfounded.
Medium is a hub to many interesting reads. I read a lot of articles before I decided to start writing. Consider joining Medium using my referral link!
I recommend you always follow the the below steps whenever you come across a trading technique or strategy:
- Have a critical mindset and get rid of any emotions.
- Back-test it using real life simulation and conditions.
- If you find potential, try optimizing it and running a forward test.
- Always include transaction costs and any slippage simulation in your tests.
- Always include risk management and position sizing in your tests.
Finally, even after making sure of the above, stay careful and monitor the strategy because market dynamics shift and make the strategy unprofitable.
For the PDF alternative, the price of the book is 9.99 EUR. Please include your email in the note before paying so that you receive it on the right address. Also, once you receive it, make sure to download it through google drive.