
Tips for Social Media Analytics for Personal Use
The Quickest Analytics to Build Your Instagram Business
The best way to quickly scrape and analyse instagram data

My Follower Growth has been stagnant. Why?
What should I do to engage my followers?
Problem Statement
Imagine you were a business owner who set up a florist shop. Excited to promote your new enterprise, you signed up for Instagram Business Account.
In just one month, you had grown your followers to 200. You were confident that your posts had been super engaging. So you pushed yourself to create more contents expecting for similar growth.
But by the next quarter, you did not receive the high growth you expected. It seems, you were no longer pushing engaging contents.
So what was the issue? how would you fix it? How would you engage with your followers effectively?
Enter Instagram Analytics
Solution: Mine and Track your Instagram Metrics
Then visualize freely with Google Data Studio.
Why Am I writing about this?
I volunteered for Yayasan Merajut Hati (YMH), a non profit organization aiming to increase mental health awareness for Indonesian youths especially during the pandemic.
Developing data analytics pipelines for YMH social media allows them to gauge engagement in real time and mine insights to create better posts. Over time, each post is a testing ground for new insights to supervise better content creations.
Similarly, this will be useful for businesses/organizations/influencers to gain insights quickly and freely
Developing Instagram Business Statements
“Life without goals is like a race with no finish line; you’re just running to nowhere” — Unknown
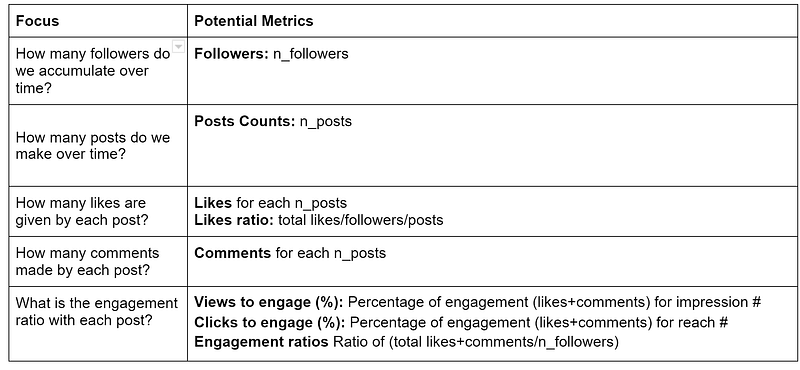
Let’s define our Key Performance Indicator (KPI)
I came up with five key metrics for your marketing Analytics KPI. Feel free to adjust it as necessary.
Setting up scripts to pull Instagram data
Disclaimer
Please use this technique responsibly and follow Facebook Regulations. I also suggest using Facebook Graph API which is available for Instagram Business.
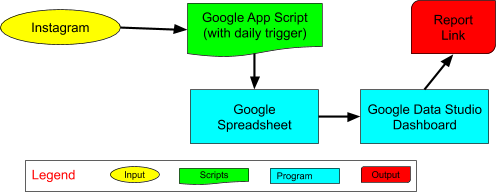
Data Architecture Illustrations
Explanations
We used Google AppScript for data scraping automation, Google Spreadsheet for data storage, and Google Data Studio for interactive dashboard.
These tools are used because:
- Free: You only need a Google account to build your pipeline.
- Online sharing and collaboration: just like Google Docs.
- Simple Scripting with Auto Triggers: Google Appscript supports scripting with daily/weekly/monthly triggers
- Easy to debug: Google Spreadsheet is used to store the data, no scripting is needed to query which is very important to collaborate with non-techies (clients, researchers, marketers, etc)
- Automated reporting: Google Data Studio sends reports to stakeholders automatically.
Extracting Instagram Data
User metadata
Instagram runs on a REST service where you can extract the user metadata value with this pattern
https://www.instagram.com/{USER_ID}/?__a=1USER_ID denotes Instagram Account. For example, you can pull a user specific data with vincent.tatan (my user ID).
e.g (my own): https://www.instagram.com/vincent.tatan/?__a=1When you browse this URL, you will receive the following JSON String.
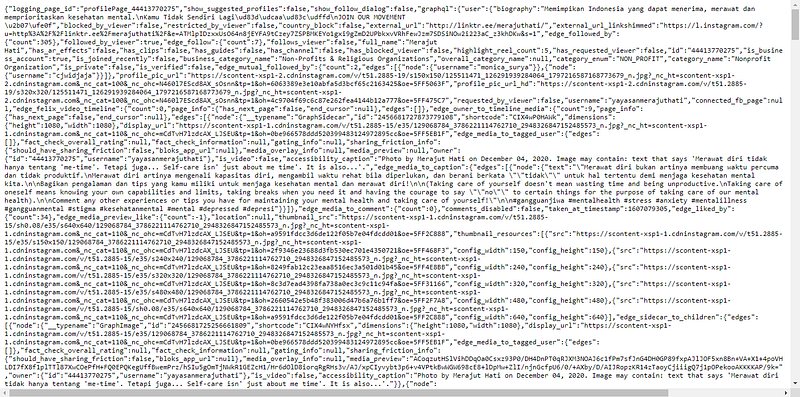
This JSON string shows all Instagram public metrics such as: likes, comments, posts, followers, etc.
If your browser shows the info as “Raw Data”, you can either click on the JSON tab (like with Mozilla Firefox) or use an external JSON viewer to return the text as JSON output.
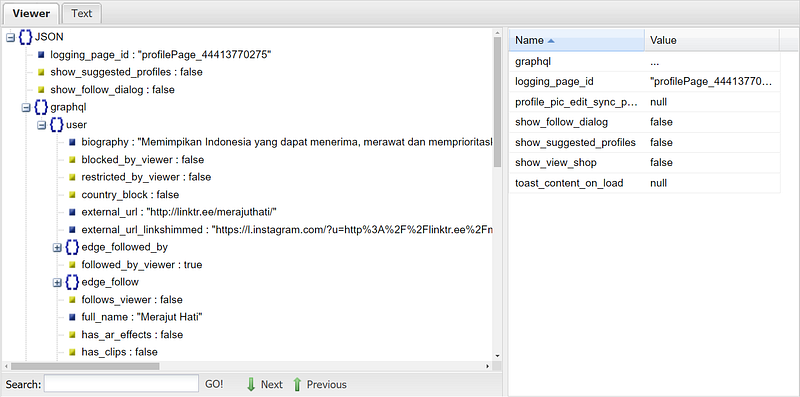
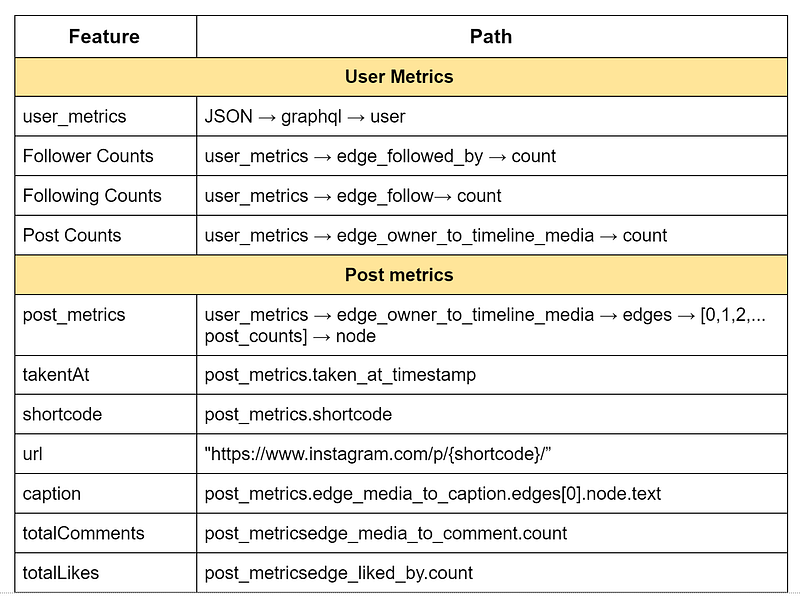
Upon closer look, you will find these Instagram features in these specific paths.
Accessing Google Appscript
To access the scripts used by extractions, you should follow these steps:
- Create a copy of this spreadsheet.
- Go to Tools
- Click Script Editor
Pulling Instagram Account Data
Run the following commands to pull and parse the JSON string from a certain user id.
var url = "https://www.instagram.com/vincent.tatan/?__a=1";
var source = UrlFetchApp.fetch(url, opt).getContentText();
var data = JSON.parse(source);
Note: If you get stuck and it returns “Unexpected token <”. This means you encountered a crawling prevention mechanism in Instagram. If you encounter this issue, you should build up your own web cookie to make the crawl legitimate. The cookie setup syntax can be referred to in my script. More info.
Identifying Trends and Post Data
Once we have access to the JSON file, we can use the following functions in these files:
- General.gs : reading general user information
- Post.gs : reading and writing posts information .
A simple extraction looks like this
var follower_counts = parseInt(json_file[‘graphql’][‘user’][‘edge_followed_by’][‘count’]);
var get posts_info= json_file[‘graphql’][‘user’][‘edge_owner_to_timeline_media’];
With this snippets, You could write the features into your spreadsheet.
var ss = SpreadsheetApp.getActiveSpreadsheet();
var general_trends = “General Trends”;
var general_sheet = ss.getSheetByName(this.general_trends);
function appendGeneral(current_date, followers, medias, following, engagement, general_sheet)
{
general_sheet.appendRow([current_date, followers, following, medias.count, engagement.totalLikes, engagement.totalComments, engagement.EngagementRatio]);
}
Congratulations, you have automatically extracted your own Instagram data.
Note: By default Googlescript is similar to Javascript notation which are commonly used for web dev interaction language. If you are still not familiar, feel free to look into AppScript documentation.
Automated Daily Triggers to Extract Data
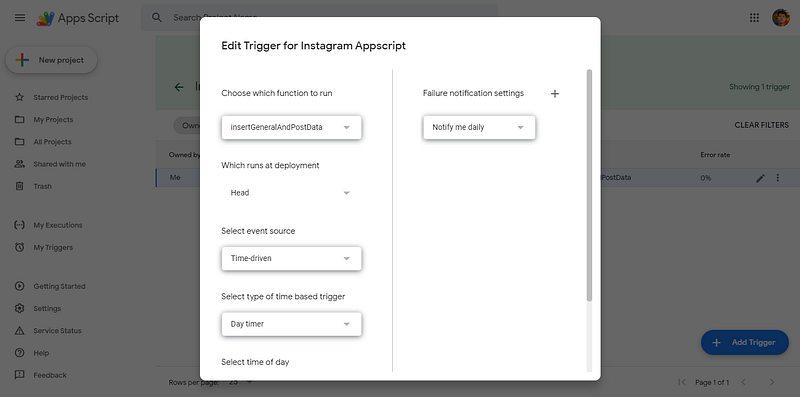
In the Appscript interface, you can the “Triggers” at the left menu bar.
You can set it to run “InsertGeneralAndPostData” function and run it every day at your given time.
That’s it! Now sit back and relax, as Google Server will automatically run the scripts to generate fresh data even when you are not online.
Building Visualizations with Google Data Studio.
Once done, you can set up your visualization using Google Data Studio. I encourage you to read my blog posts about building dashboards quickly and launch a simple project.
Conclusion
Extracting data in Instagram is a rewarding way to get your data in a reliable manner. It saves you time and help you look into trends as you refresh the statistics daily.
In this post, you have learnt:
- How to develop Marketing Metrics and KPI
- Scripting to extract Instagram data
- Creating automated triggers for daily extraction
Using this dashboard, I successfully advised YMH on their content creation. Within January, we have increased our followers by ~23% from 361 to 446 and generated insights for influencer driven posts and readability. I sincerely hope you can run this analysis for your business/personal accounts.
Note: In the future, I hope to share how you can expand the fields/metrics using the Facebook Graph API
Thank you to Albert Bingei and ranon sim for revising this post.
Soli Deo Gloria
More Tips from Author:
- How to Build Your Ultimate Data Science Portfolios
- How to Build a Stunning Interactive Dashboard within 10 Minutes
- The Basic of Google Data Studio
- The Hidden Gems of Writing Analytics
About the Author
I fight phishing with ML @ Google.
What I love about my job is that I use advanced ML algorithms and MLOps to protect Chrome, Gmail and Android users against phishing attacks which potentially steal life savings from vulnerable populations every week.
I am also a writer for Towards Data Science Medium to guide aspiring ML and data practitioners with 500k+ viewers globally.


