
The Only 30 Methods You Should Master To Become A Pandas Pro
After using pandas for over three years, here are the 30 methods I have used almost all the time

Pandas is undoubtedly one of the best libraries ever built in Python for tabular data-wrangling and processing tasks.
Being open-source, numerous developers from different parts of the world have contributed to its development and brought it to where it is today — supporting hundreds of methods for various tasks.
However, if you are a newbie and trying to get a firm hold at the Pandas library, things can appear very daunting and overwhelming at first if you start with Pandas’ Official Documentation.
The list of topics is shown below:
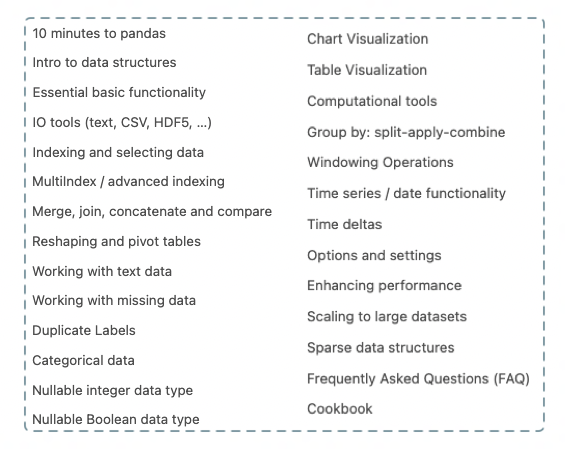
Having been there myself, this blog is intended to assist you in getting started with Pandas.
In other words, in this blog, I will reflect on my 3+ years of experience using Pandas and share those 30 specific methods that I have used almost all the time.
You can find the code for this article here.
Let’s begin 🚀!
Importing the library
Of course, if you want to use the Pandas library, you should import it. The widely-adopted convention here is to set the alias of pandas as pd.
#1 Reading a CSV
CSVs are typically the most prevalent file format to read Pandas DataFrames from.
You can use the pd.read_csv() method to create a Pandas DataFrame:
We can verify the type of object created using the type() method.
#2 Storing a DataFrame to a CSV
Just as CSVs are prevalent to read a DataFrame from, they are also widely used to dump a DataFrame to as well.
Use the df.to_csv() method as shown below:
The separator (sep) indicates the column delimiter and index=False instructs Pandas to NOT write the index of the DataFrame in the CSV file.
#3–4 Creating a DataFrame
To create a Pandas DataFrame, the pd.DataFrame() method is used:
From a list of lists
One popular way is to convert a given list of lists to a DataFrame:
From a Dictionary
Another popular way is to convert a Python dictionary to a DataFrame:
You can read more about creating a DataFrame here.
#5 The Shape of the DataFrame
A DataFrame is essentially a matrix with column headers. Therefore, it has a specific number of rows and columns.
You can print the dimensions with the shape argument as follows:
Here, the first element of the tuple (2) is the number of rows and the second element (3) is the number of columns.
#6 Viewing Top N Rows
Typically, in real-world datasets, you would have many rows.
In such situations, one is usually interested in viewing just the first n rows of the DataFrame.
You can use the df.head(n) method to print the first n rows:
#7 Printing the Datatype of columns
Pandas assigns an appropriate data type to every column in the DataFrame.
You can print the datatype of all columns using the dtypes argument:
#8 Modifying the Datatype of a column
If you want to change the datatype of a column, you can use the astype() method as follows:
#9–10 Printing Descriptive Info about the DataFrame
Method 1
The first method (df.info()) is used to print the missing-value stats and the datatypes.
Method 2
This is relatively more descriptive and prints standard statistics like mean, standard deviation, maximum etc. of every numeric-valued column.
The method is df.describe().
#11 Filling NaN values
Missing data is almost inevitable in real-world datasets.
Here, you can use the df.fillna() method to replace them with a specific value.
Read more about handling missing data in my previous blog:
#12 Joining DataFrames
If you want to merge two DataFrames with a joining key, use the pd.merge() method:
#13 Sorting a DataFrame
Sorting is another typical operation that Data Scientists use to order a DataFrame.
You can use the df.sort_values() method to sort a DataFrame.
#14 Grouping a DataFrame
To group a DataFrame and perform aggregations, use the groupby() method in Pandas, as shown below:
#15 Renaming Column(s)
If you want to rename the column headers, use the df.rename() method, as demonstrated below:
#16 Deleting Column(s)
If you want to delete a column, use the df.drop() method:
#17 Adding New Column(s)
The two widely used approaches to add new columns are:
Method 1
You can use the assignment operator to add a new column:
Method 2
Alternatively, you can also use the df.assign() method as follows:
#18–21 Filtering a DataFrame
There are various ways to filter a DataFrame based on conditions.
Method 1: Boolean Filtering
Here, a row is selected if the condition on that row evaluates to True.
The isin() method is used to select rows whose value belongs to a list of values.
You can read about string-based filtering in my previous blog:
Method 2: Getting a Column
You can also filter an entire column as follows:
Method 3: Selecting by Label
In label-based selection, every label asked for must be in the index of the DataFrame.
Integers are valid labels too, but they refer to the label and not the position.
Consider the following DataFrame.
We use df.loc method for label-based selection.
However, in df.loc[], you are not allowed to use position to filter the DataFrame, as shown below:
To achieve the above, you should use position-based selection using df.iloc[].
Method 4: Selecting by Position
#22–23 Finding Unique Values in a DataFrame
To print all the distinct values in a column, use the unique() method.
If you want to print the number of unique values, use nunique() instead.
#24 Applying a Function to a DataFrame
If you want to apply a function to a column, use the apply() method as demonstrated below:
You can also apply a method to a single column as follows:
#25–26 Handling Duplicates
You can mark all the repeated rows using the df.duplicated() method:
Further, you can drop the duplicated rows using the df.drop_duplicates() method as follows:
#27 Finding the Distribution of Values
To find the frequency of each unique value in a column, use the value_counts() method:
#28 Resetting the Index of a DataFrame
To reset the index of the DataFrame, use the df.reset_index() method:
To drop the old index, pass drop=True as an argument to the above method:
#29 Finding Cross-tabulation
To return the frequency of each combination of values across two columns, use the pd.crosstab() method:
#30 Pivoting DataFrames
Pivot tables are a commonly used data analysis tool in Excel. Similar to crosstabs discussed above, pivot tables in Pandas provide a way to cross-tabulate your data.
Consider the DataFrame below:
With the pd.pivot_table() method, you can convert the column entries to column headers:
Congratulations 🎊, you have just learned about the 30 most useful methods in Pandas.
To conclude, I can confidently say that you will likely use these methods 95% of the time working with Pandas.
The study is backed by my own experience as well as working with fellow Data Scientists and seeing their work.
Thanks for reading. I hope this post was helpful.
✉️ Sign-up to my Email list to never miss another article on data science guides, tricks and tips, Machine Learning, SQL, Python, and more. Medium will deliver my next articles right to your inbox.


