
The No-Code Pandas Alternative That Data Scientists Have Been Waiting For
A step towards simplifying data analysis for all

Motivation
Story-telling is immensely critical to the workflow of all data science projects.
In this regard, drawing valuable insights from data is a fundamental skill every organization looks for in a data scientist.
Thankfully, over the past few years, developers across the globe have profoundly contributed towards developing reliable and sophisticated tools that make a data scientist’s job relatively easier.
The most popular open-source tools for Python include Pandas, NumPy, Matplotlib, Seaborn, and many more.
Essentially, these tools allow the users to perform various data analysis operations using coded instructions.
While their immense utility makes them almost indispensable today to the workflow of a data science project, I believe that:
→ #1 Beginners without prior experience often get overwhelmed in an attempt to get hold of these tools.
→ #2 What’s even more concerning is that Experts spend a considerable amount of time and energy daily writing the same code repeatedly to perform data analysis across different projects.
- To get some perspective here, try remembering the number of times you have explicitly written
df.sort_values(),pd.merge(),df.value_counts(), or created different scatter plots by writing the same code over and over. - In simple words, redundancy is more frequent than you think, which inhibits work output.
Hence, both groups particularly look for time-saving, no-code, and GUI-based tools that:
- Have extremely low entry barriers for beginners.
- Help experts eradicate redundant work and do what matters to them.
One may argue that Excel can be a potential option in such cases. I partly agree with that, as the biggest issue with Excel is its max row limit. This inhibits working on projects involving data analytics at scale.
To this end, what I am especially interested in discussing in this blog is a potential no-code assistive tool for data analysis using Pandas, called Gigasheet.
To make tabular data analysis relatively easier, I will perform 15 typical operations in Pandas and demonstrate how you can do them with just a few clicks of a button using Gigasheet.
Let’s begin 🚀!
Prerequisites
To use Pandas, you should import the library first. This is shown below:
To use Gigasheet, you should have a Gigasheet account, and everything comes pre-installed.
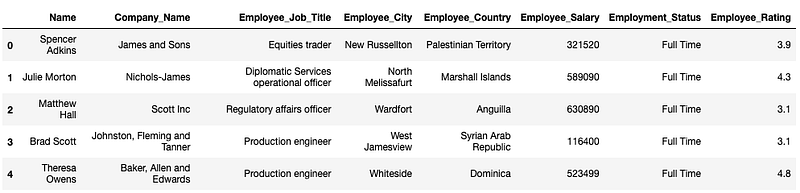
Dataset
I will use a self-created dataset of 300K rows and nine columns for this blog. The first five rows are shown below:
#1 Reading a CSV
Pandas
You can use the pd.read_csv() method to read a CSV file and create a Pandas DataFrame.
Gigasheet
Reading a CSV is pretty simple here too. Just upload the CSV file, and you are good to go.
You can also upload other file formats such as JSON, XLSX, TSV, GZIP, and many more.
Alternatively, you can leverage data connectors such as Amazon S3, Google Drive, Dropbox, etc., to upload your dataset. This saves time in uploading the file from the local machine.
#2 Dimensions of the DataFrame
Pandas
If you want to print the shape of the DataFrame (number of rows and columns), you can use the shape attribute of the DataFrame.
Gigasheet
Here, the shape is displayed once you upload the file.
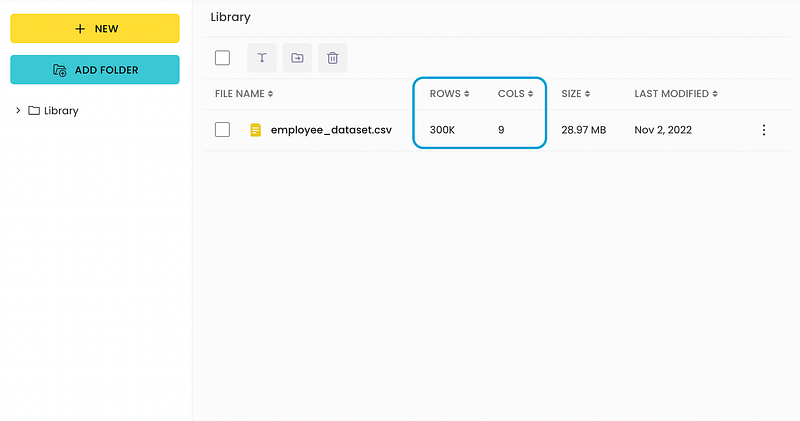
Note: It counts one extra column that accounts for the index.
#3 Viewing Top N Rows
Typically, in real-world datasets, you will have many rows to deal with.
In such situations, one is usually interested in viewing just the first n rows of the DataFrame.
Pandas
You can use the df.head(n) method to print the first n rows:
Gigasheet
Once you open the sheet, it shows the top 100 rows by default. This gives you a quick glimpse into the dataset.
#4 Viewing the Datatype of a column
Pandas
You can view the datatype of a column with the dtypes argument.
Gigasheet
To view the datatype of a column, click on the specific column header and select “change data type.”
The datatype appears as highlighted text, “Plain Text” in this case for the Company_Name column.
#5 Modifying the Datatype of a column
Pandas
To change the datatype of a column, you can use the astype() method as follows:
Gigasheet
To change the datatype of a column, click on the specific column header and select “change data type.”
As you may have noticed, the modification is not inplace. Simply put, it automatically creates a new column with the desired data type and hides the original column for future reference.
#6 Deleting a Column
Pandas
If you want to delete a column, use the df.drop() method:
Gigasheet
There are two ways to delete a column from the workspace.
The first approach is temporarily hiding the columns from the sidebar on the right.
The second method is to delete the column permanently. To achieve this, click on the specific column header and select “Delete.”
#7 Printing Descriptive Info about the DataFrame
Pandas
df.info() anddf.describe() are two popularly used methods to generate statistical information about a DataFrame.
Gigasheet
You can view the above information using various aggregations available at the bottom of the sheet.
#8 Sorting a DataFrame
Pandas
You can use the df.sort_values() method to sort a DataFrame.
Gigasheet
#9 Renaming Column(s)
Pandas
If you want to rename the column headers, use the df.rename() method, as demonstrated below:
Gigasheet
To change the name of a column, click on the specific column header and select “Rename.”
#10 Filtering a DataFrame
Pandas
There are various ways to filter a DataFrame. These include Boolean filtering, selecting a column, Selecting by Label, Selecting by Position, etc.
Gigasheet
To filter a DataFrame, head over to the “Filter” tab. Select the column and specify the condition you want to filter on.
Additionally, it shows the number of rows after filtering at the bottom of the sheet.
#11 Split a Column
Pandas
If you want to split a column into multiple columns (say Name to First_Name and Last_Name), you can use thesplit() method for a string column.
Gigasheet
To split a column, head over to “Tools” → “Columns” → “Split.”
#12 Grouping a DataFrame
Pandas
You can use the groupby() method in Pandas to group a DataFrame and perform aggregations:
Gigasheet
To group the DataFrame, head over to the “Group” button in the top bar.
After grouping, you can perform all sorts of common aggregations here.
#13 Adding New Column
Pandas
You can use the assignment operator to add a new column:
Gigasheet
Here, you can head over to “Insert” → “Calculations” and perform the above operation as shown below:
#14 Merging DataFrame
Pandas
If you want to merge two DataFrames with a joining key, use the pd.merge() method:
Gigasheet
To demonstrate this, I will merge the following CSV file. The merge column is Employment_Status.
The steps are demonstrated below. We will use the “Cross File VLOOKUP” tool to merge dataframes.
#15 Storing a DataFrame to a CSV
Pandas
You can use the df.to_csv() method to dump a DataFrame to a CSV, as shown below:
Gigasheet
The steps to save the DataFrame are shown below (File → Export).
Conclusion
In this blog, I demonstrated how you can leverage Gigasheet to perform the 15 most common Pandas operations without writing any code.
I am a big fan of no-code solutions. In my opinion, they are literally game-changers when it comes to eliminating redundant work, thereby making life easier.
Of course, I agree that coded solutions offer customization (and much more), which is one of its most significant benefits. Thus, to reiterate, I am not claiming that Gigasheet is (or will be) the ultimate replacement for Pandas.
However, as per my experience, I believe that Gigasheet is extremely handy for beginners as it lowers the barriers to starting with fundamental operations in data science.
This blog will help beginners to learn how to back reference operations in Gigasheet to Pandas.
At the same time, this blog can also help experts in the field to translate common Pandas operations to Gigasheet. This will help them work faster and effortlessly by avoiding the redundancy of writing the same code repeatedly.
Another potential set of users that can take advantage of Gigasheet is Excel users. One may argue that most of the operations demonstrated in this blog can be easily performed in Excel.
However, the biggest issue with Excel is its max row limit. This inhibits working on large-scale data analytics projects, which Excel does not support.
To conclude, while Gigasheet is not yet in the realm of killing off Pandas (or Excel), the trajectory certainly exists. I’m eager to see how they continue!
As always, thanks for reading! I would love to read your responses :)
I like to explore, experiment and write about data science concepts and tools. You could connect with me on LinkedIn.


