
The next generation of storytelling
How can AI help us discover new ways to create and tell stories?
Explaining AI with visual narratives
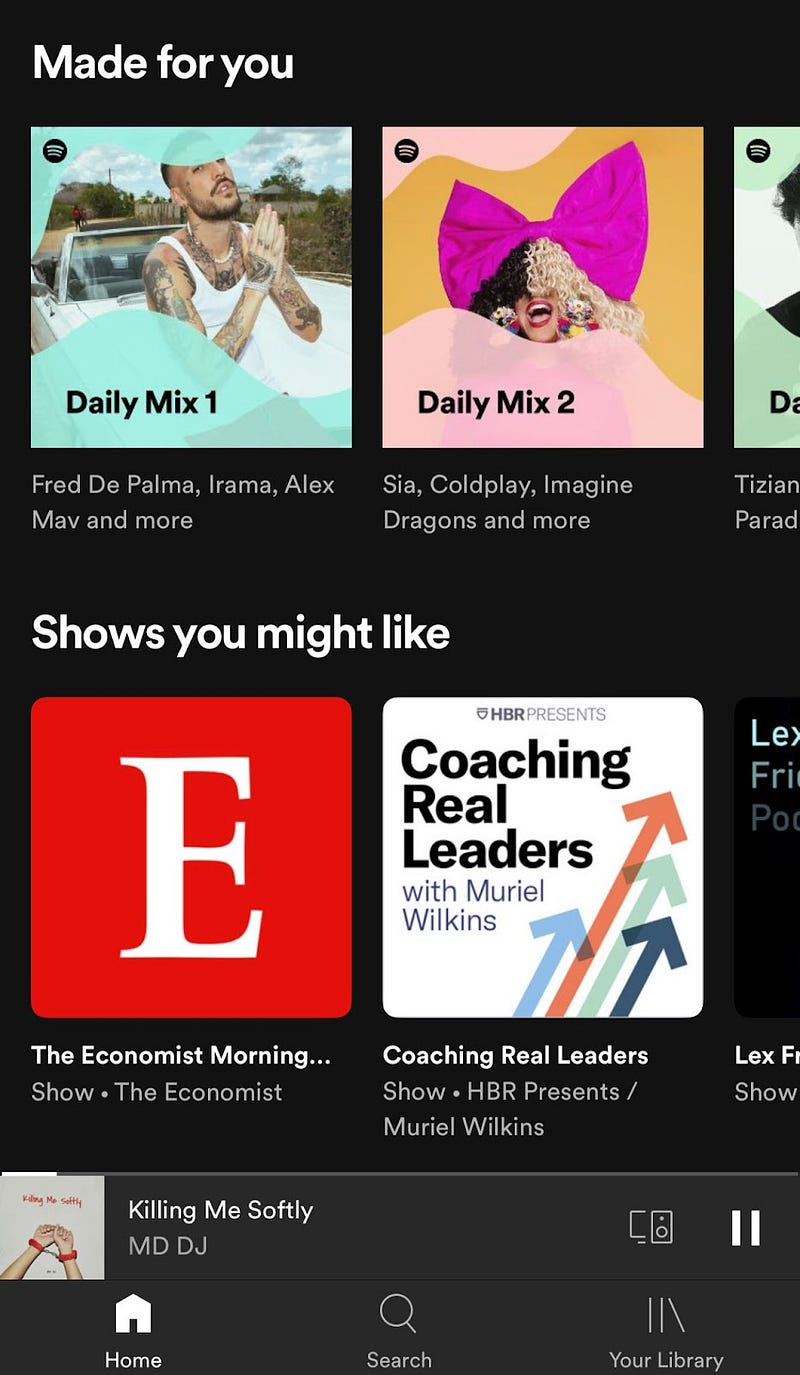
I heard a song recently on one of Spotify’s curated “Made for You” playlists, and it hit me that I hadn’t heard that particular song in ages. I used to listen to it constantly and Spotify didn’t even exist back then. How could its algorithm possibly have known it was relevant to me? Yep, that’s a rhetorical question. Surprise, surprise: it isn’t only historical data that feeds algorithms.
So, you might wonder — What other data are being used to predict my interests in music?
That, I’m sorry to say, is a question for engineers building algorithms and training models, but it is a good question. A question I’d like to find an answer to every time that, for example, Netflix recommends me a new show that I end up loving like crazy or, speaking of less frivolous topics when I hear a friend of mine complaining because she did not qualify for a second credit card.
It would be useful to have a behind-the-scenes window to peek at the algorithms making the decisions that impact our lives and see what’s behind the final output we get. In fact, AI is so pervasive in our lives that people don’t always realize when it’s being employed. Often the use of this technology is so subtle that it could be easily hidden behind a simple picture or a phone notification. After all, if you don’t know the rules, how could you possibly understand the game?
Having a clear explanation of the data that has been used to train a model, how the model works, and how it is being deployed is so crucial to gain full control of how AI impacts us. This refers to everyone, but especially to those who are not technically savvy and know very little about how AI works.
To enhance people’s awareness of AI, we have to first explain the meaning of a model’s recommendations and the context surrounding that final output. My background in data journalism and information design inspired me to question the methods we usually employ to communicate the results of models and algorithms.
How can we reimagine the ways we communicate the AI’s outcome?
I don’t know about you — you can probably still sleep at night without having an answer to this — but this question is stuck in my mind.
The curiosity about the inherent complexity of models led me to experiment with novel ways to illuminate the richness of the data provided by AI technologies. For example, the output of a machine-learning model is not only about its final predictions.
Underlying the ML’s predictions is a huge variety of other information that is integral to the final result: the data used for training the model, the understanding of that data lineage and provenance, the bias that might be detected, the new data created over a feature engineering process, the features’ score, and more and more data… This is only a small part of the meta-information that we might think of that underlying the final result of an ML model. And yes, if your mind is about to blow up, you are on the right track, dude. 🤯 🧠
Think of all the algorithms governing our lives and decisions: AI opened up an entirely new world of information that represents the simultaneous combination of multiple processes, tools, and data.
As you might have started guessing, the complexity of a final model’s result is enormous, and we, as humans, need a better way not to only access this information, but to comprehend it. Therefore, understanding how AI works and impacts our lives is crucial. To do so, every time we work with AI, we have to put a genuine effort into unlocking the context of the data behind its outcome.
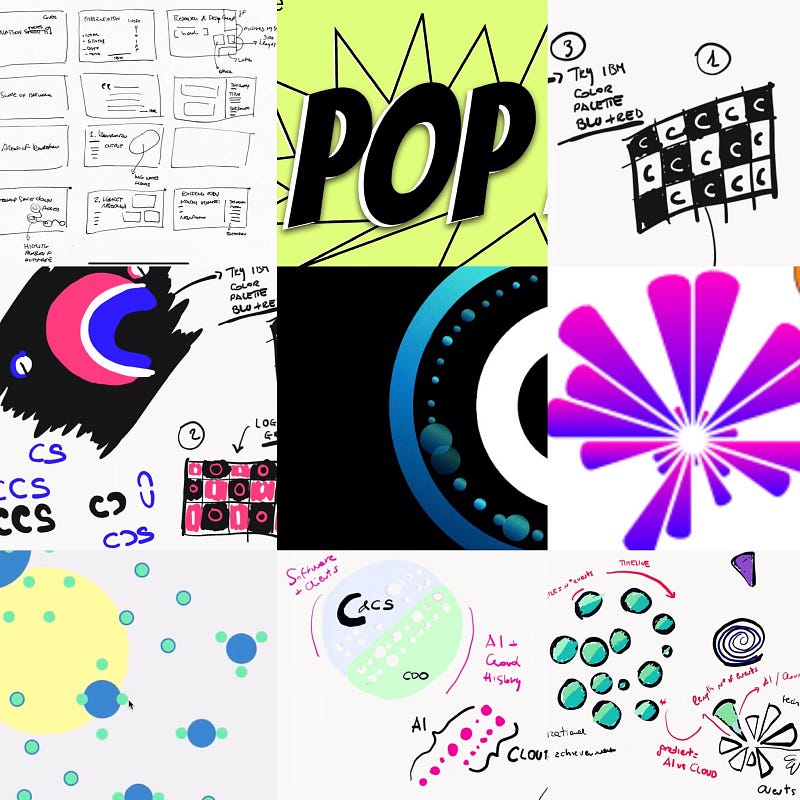
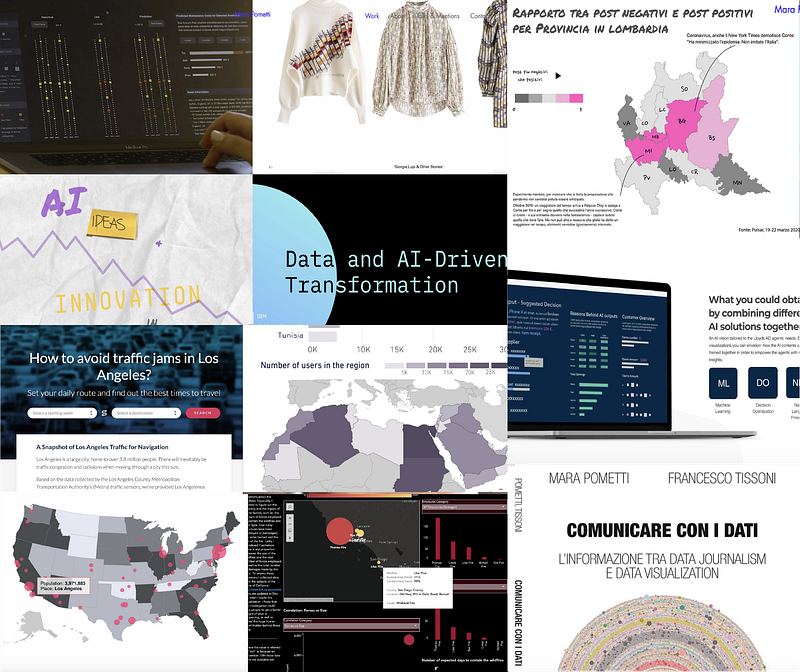
Many of my projects focus on envisioning new ways to represent the results of AI models and facilitating public understanding of AI. The foundation of these projects is research and experimentation with the use of data storytelling applied to AI practices.
I believe that, without experimenting, we can’t come up with new ideas. Even if sometimes it means working on projects that might look more like a moonshot without any immediate valuable result. It’s by doing and practising that we can advance our knowledge of what works and what doesn’t when it comes to interaction between humans and AI.
This brings me to a project I started last year in an effort to reinvent the content we can create with NLP and NLU’s data. I named this project Interviews Visualized and it was a fun way to combine the art of storytelling, data design, NLP algorithms, and IBM Watson Natural Language Understanding. Let me bring you straight into my workshop to explain what this project was about. I hope it will spark some new ideas for your future work… follow me!
AI reveals the stories hidden in our words
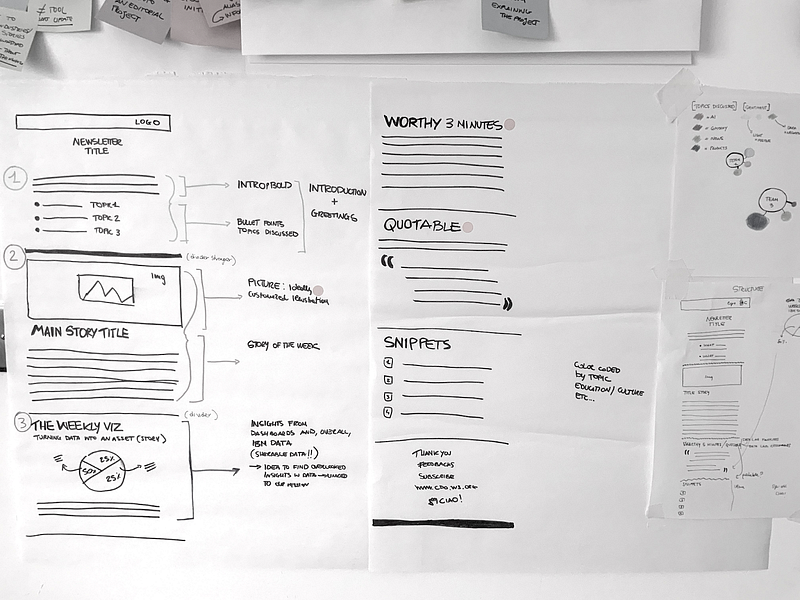
Last year, I happened to run a newsletter for the team I worked for at IBM. While brainstorming the content for the newsletter and designing its layout, I remember wanting to integrate data storytelling into it. Yet the question was: how? Over the years, working with data on a daily basis has become so rooted in my mindset and working process that I often can’t think of any ideas without being driven by data first. I try to include data storytelling in everything I do because there is no better way of revealing the insights hidden in data. However, it wasn’t until I wrote the very first issue of the newsletter that I had the idea of how to incorporate data into it.
As I logged the transcripts of the interviews of the people I’d spoken to, I began to wonder about the actual meaning of their words: which ones were the most relevant, and why? How did those words relate to specific sentences and passages in the text? What was their context, their connotation, and so on… It was at that point that I started writing an NLP algorithm to find answers to my questions in order to reveal the hidden connections existing in the story’s sentences and words.
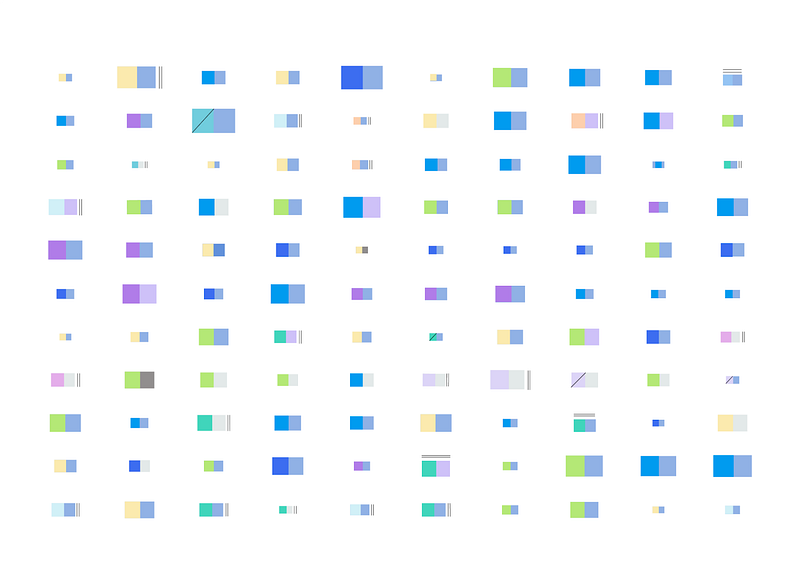
By extracting additional meaning from the stories I would write, I wanted to provide readers with a second layer of information: all the information they could not see in the text itself. To give readers the ability to see the patterns existing in the text’s words, I combined NLP techniques, IBM Watson NLU and data design to visualize the structure and semantics of the words used in the newsletter. In this way, I transformed the data generated as the output of a model into a compelling visual story.
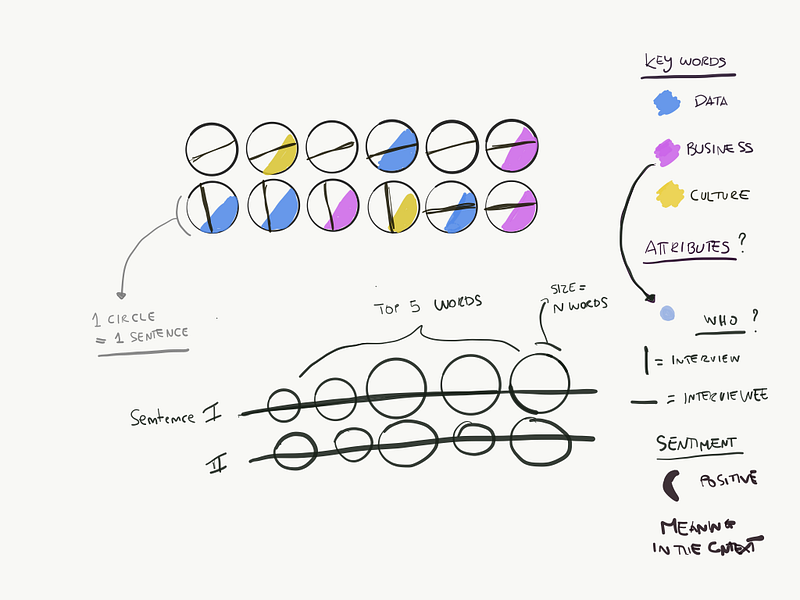

As soon as I created and applied the first NLP algorithm to the text, I realized how many overlooked patterns existed between the words used by the people I interviewed: NLP illuminated the human side of the words chosen and returned people a new way to explore a written text more in-depth.
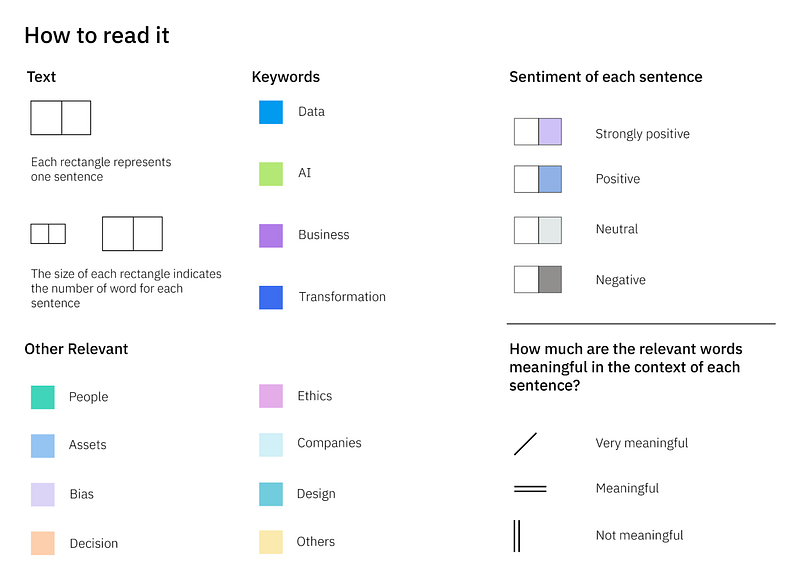
Following this concept, I came up with a visual way to represent all this information and attached a legend to every visual story to encourage people to take the time to explore the data and go deeper into the details.
The ultimate purpose of this experiment, which kept going for several weeks with several visual data narratives, was to find new ways to make AI and ML technologies more accessible to a broader audience of non-experts and to create new strategies to communicate the content generated by algorithms and models.
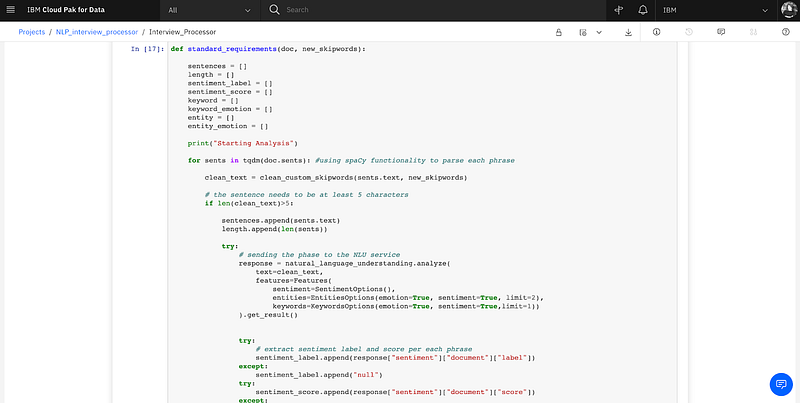
I felt so much potential in this project that I scaled up the initial algorithm that I created by partnering with a fantastic data scientist and colleague of mine, Erika Agostilli, to leverage the capabilities of Watson NLU to allow my visual stories to express even more details and rich context than I could do with my own algorithm.
Scaling up the project in such a way allowed us to create a little engine, which Erika and I called Interviews Processor, that I used to parse the text of each story I published in the newsletter.
Numbers “can help remedy our human fallibilities. What’s easy to forget is that statistics can amplify these fallibilities, too.” —Hannah Fry
It’s not algorithms’, data’s, or numbers’ fault if sometimes human judgment is mistaken. Our mistakes have more to do with how we communicate the numbers provided by algorithms and models: how we manage to communicate the context those numbers relate to, the level of uncertainty they bring with them, how that uncertainty reflects into the world, and how those numbers affect people’s lives.
I believe that we will never even get close to painting the complexity of this AI in its entirety.
But we can try, every time we deal with data, by exerting a genuine effort to connect data to people and explain its richness and complexity as best as we can. Visual data stories are the most powerful means we have to do that.
About AIxDesign
AIxDesign is a place to unite practitioners and evolve practices at the intersection of AI/ML and design. We are currently organizing monthly virtual events, sharing content, exploring collaborative projects, and developing fruitful partnerships.
To stay in the loop, follow us on Instagram, Linkedin, or subscribe to our monthly newsletter to capture it all in your inbox. You can now also find us at aixdesign.co.


