avatarOscar Leo

Summary

The website content discusses a data visualization project focusing on the growth and popularity of tags on Medium, with a particular emphasis on the "Money" tag's significant increase in content.

Abstract

The author of the web content has a hobby of creating visualizations from interesting data sets. In this instance, the author has analyzed the popularity and growth of Medium tags over a month, comparing data from February to March. The visualization showcases the changes in the number of stories associated with various tags, with the "Money" tag experiencing a remarkable 47% increase in just a few weeks. The author hopes that readers find this information useful and invites them to subscribe to a newsletter for more insights.

Opinions

  • The author finds the increase in stories tagged with "Money" to be noteworthy and perhaps unexpected.
  • The author values the utility of the information provided and believes it to be beneficial to the readers.
  • The author encourages readers to engage further with their work by promoting their newsletter, suggesting a pride in their content and a desire to share more insights.

Data Visualization

The Most Popular and Fastest Growing Tags on Medium

Photo by Angèle Kamp on Unsplash

One of my hobbies is to create visualizations of exciting data.

Since I collected some numbers on the most popular Medium tags in February this year, I decided to do the same exercise again in March and look at the change over time.

When you search for a tag on Medium, you reach a page displaying a few numbers for that topic. Here’s an example of “Technology”.

And here’s the visualization.

Graphic created by the author

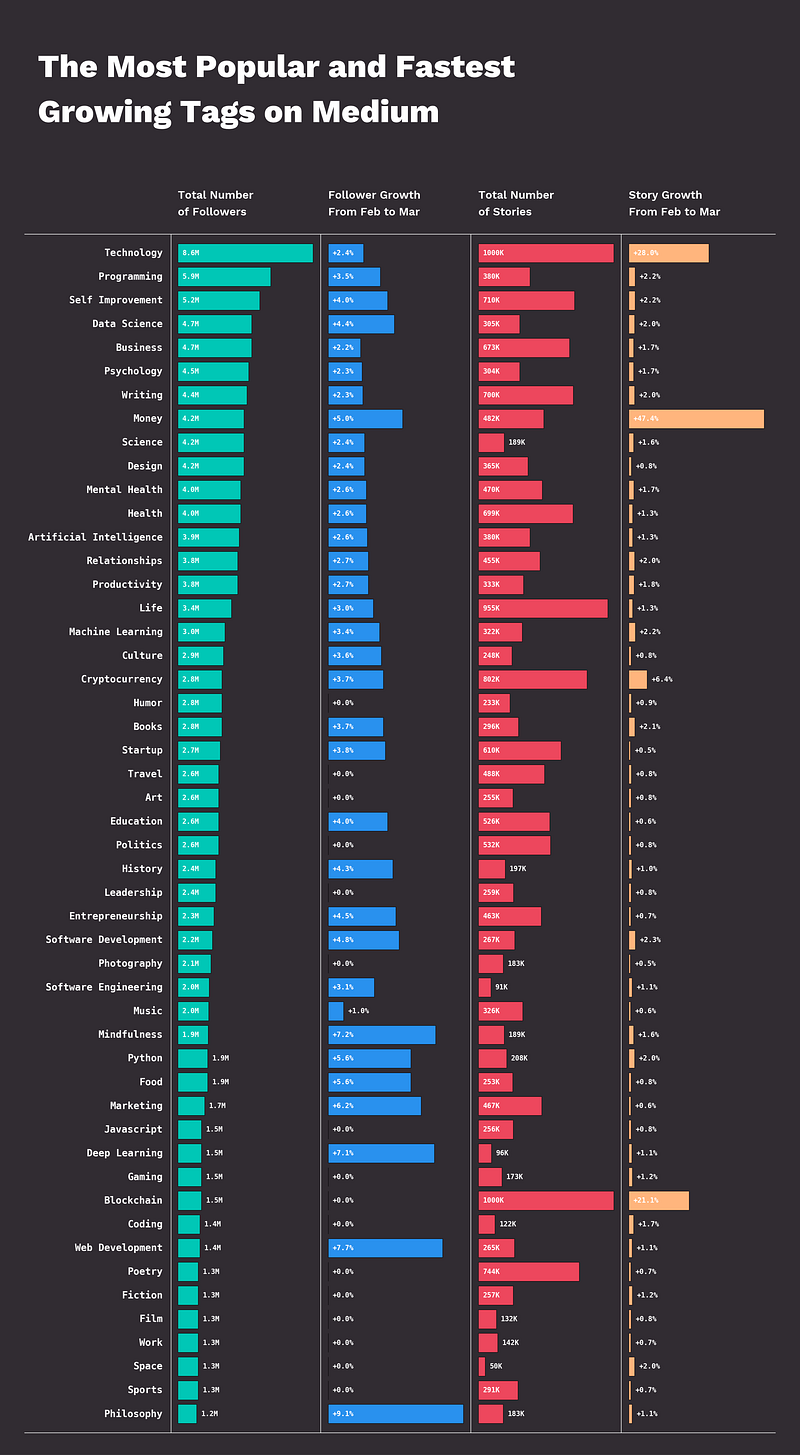
The craziest number is the 47% increase in the total number of stories for “Money” in just a few weeks.

I hope you have use for this information! 😄

If you did, check my newsletter as well at https://oscarleo.ghost.io/

Data Science
Writing
Culture
Medium
Data Visualization
Recommended from ReadMedium