
The Most Effective Chart Patterns for Trading
And How to Trade them
Previously, I was talking about Candlestick Patterns. Today, I’ll cover another type of pattern: chart patterns.
What is a Chart Pattern
A chart pattern is a shape within a chart that can be used to open or close a trade. Chart patterns work because many traders know them and act the same way when they see them. That’s why they’re called “patterns”.
For example, a pattern can be a triangle in a price chart, and every time this triangle formed in the past, the price went up a few bars after. So if you see this triangle, you know the price has more chances to go up than to go down.
There are some chart patterns every trader should know. These are:
- Double Top/Double Bottom
- Head and Shoulders
- Rising Wedge/Falling Wedge
Double Top/Bottom
Double Tops and Double Bottoms are patterns looking like this:
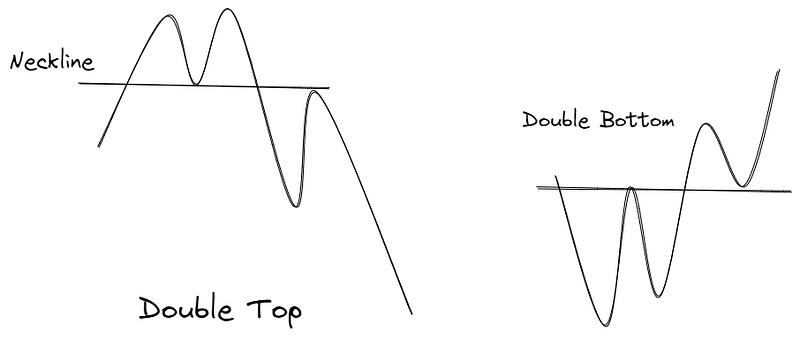
They are reversal patterns. I’ll explain just the Double Bottom because the Double Top is exactly the same thing but in the opposite direction.
A Double Bottom is composed of two local lows. A first low occurs, then there’s a pullback to a resistance we call “neckline”, then there’s another local low occurring, then a breakout of the neckline, and usually a strong reversal.
A Double Bottom occurs when in a downtrend, some traders anticipate the end of the downtrend and buy (first pullback). However, the bears resist but fail to break the old low. This allows traders to see that the market is reacting well, so they will open positions and be strong enough to break the neckline.
Usually, there’s a pullback to the neckline after the breakout. You can use this pullback as a confirmation. You can open a trade after this pullback. You can place your stop loss either just below the neckline if you’re conservative, else near the previous local low. The target of this pattern is usually more than the length from the previous low to the neckline, from the neckline.
As I said before, the Double Top is just the opposite, so you just have to reverse my explanations. Now, let’s try to find a Double Top or a Double Bottom in the chart.
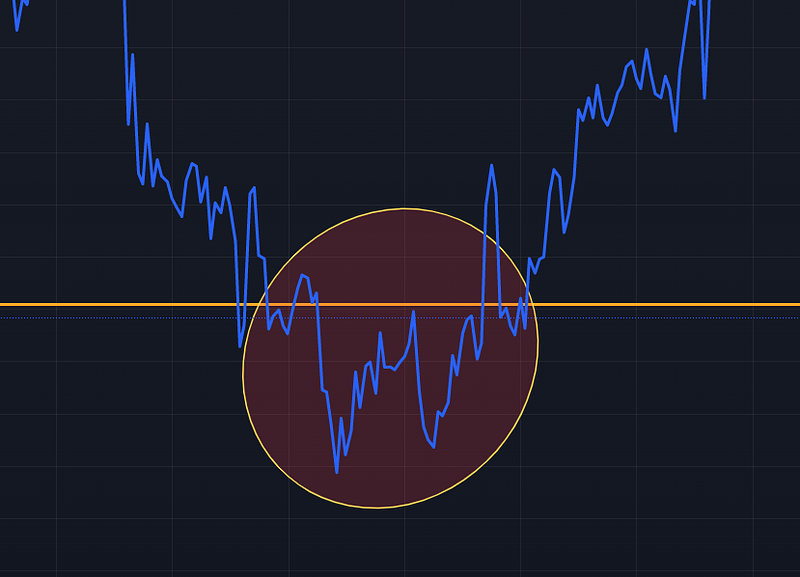
Here it’s a double bottom. As you can see, we were in a downtrend. There was a first strong reaction from the buyers to push the price higher, but the bears resisted and pushed the price lower. But they couldn’t break the previous low, so the buyers saw the market was reacting and managed to break the neckline. Finally, there was a pullback, and then the price skyrocketed.
Just a quick note: I like to use line charts to find these patterns to avoid the noise of the candlesticks. But you can also use Japanese candlesticks, you have to try by yourself and see what you preferer.
How would I’ve traded this?
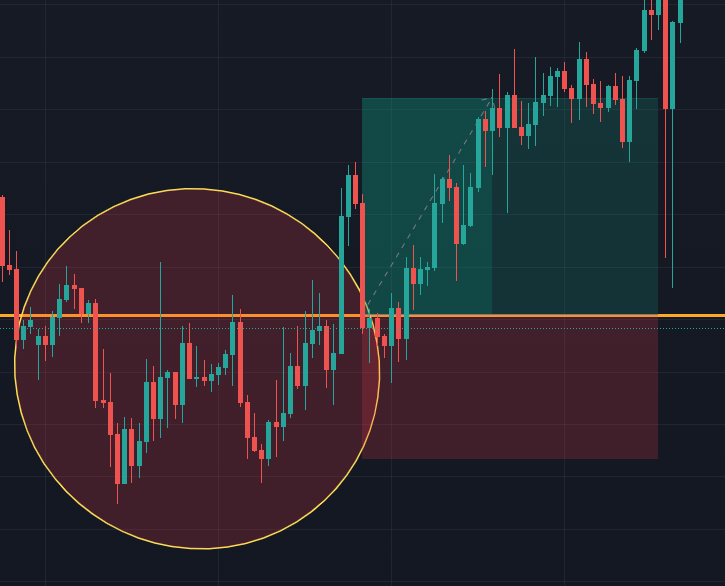
The entry is just after the pullback, on the neckline. Stop loss is placed at the previous low. And the target is 1.5 times my stop loss so I have a 1.5 RR on this trade.
Head and Shoulders
The Head and Shoulders is a pattern looking like this:
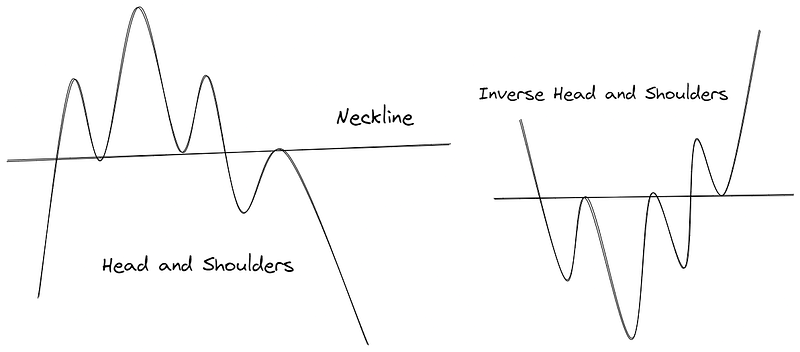
It can be bullish or bearish. When it is bullish, we call it an “Inverse Head and Shoulders”.
A Head and Shoulders is just a sequence of 3 consecutive tops, the middle one being higher than the other 2 of similar height.
It is the result of a fight between the buyers and the sellers. At first, the buyers seem stronger, but they push the price too high, so the sellers react and finally win the fight.
Usually, there’s a pullback to the neckline after the breakout. You can use this pullback as a confirmation. You can open a trade after this pullback. You can place your stop loss either just below the neckline if you’re conservative, else near one of the 3 highs depending on your risk management rules. The target is calculated the same way as for the Double Top and Double Bottom, except you can choose one of the 3 highs for your calculation.
The same rules apply for the Inverse Head and Shoulders but on the opposite side.
Now let’s find this pattern in the charts.
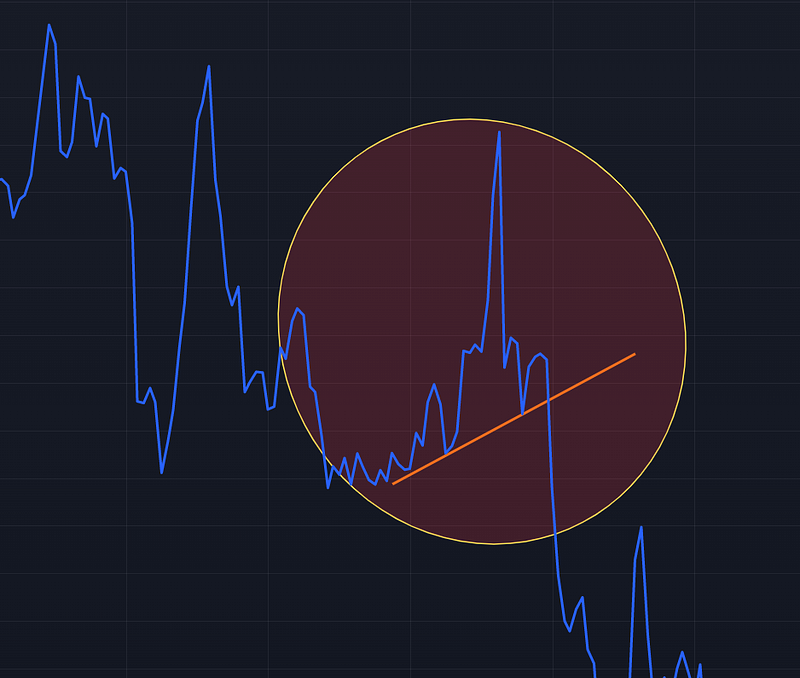
I hope the line chart doesn’t disturb you too much, but it makes things easier. So, here is a nice Head and Shoulders pattern. As you can see, the neckline is a bit inclined, but it’s not a problem, the neckline doesn’t have to be horizontal.
Personally, I would not have traded this because there was no pullback. But a pullback isn’t always needed, I know some people don’t need it to enter a trade. So here is an example of a trade you could have done, even if I wouldn’t have done this:
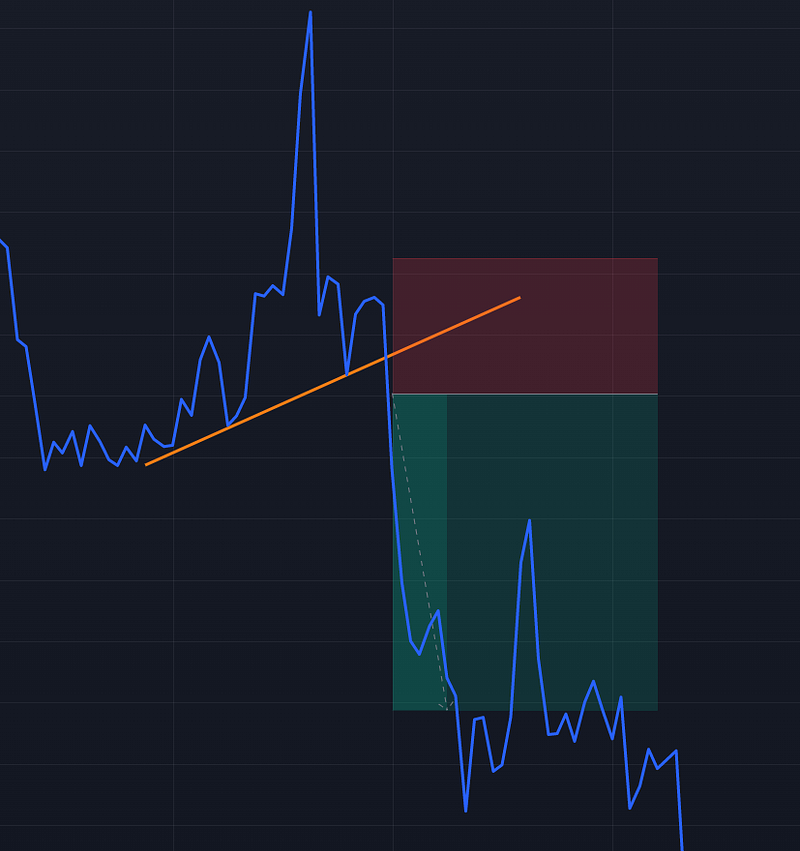
The entry is just after the breakout. The stop loss is set to the previous high, and the take profit is calculated using the distance from the higher high to the neckline.
Rising Wedge/Falling Wedge
Wedges are patterns looking like this:
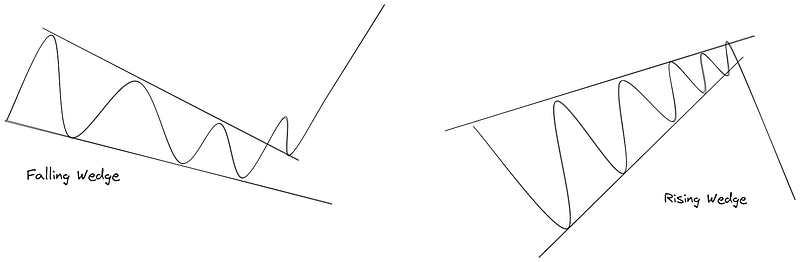
A Wedge occurs when the market is trending, but the trendlines of the lows and highs are converging.
Near the convergence point, there’s a high probability to see a trend reversal, either bullish for a Falling Wedge, or Bearish for a Rising Wedge.
For the Falling Wedge, there may be a pullback on the upper trendline. For the Rising Wedge, the pullback is usually on the lower trendline.
Let’s find a Wedge in the charts.
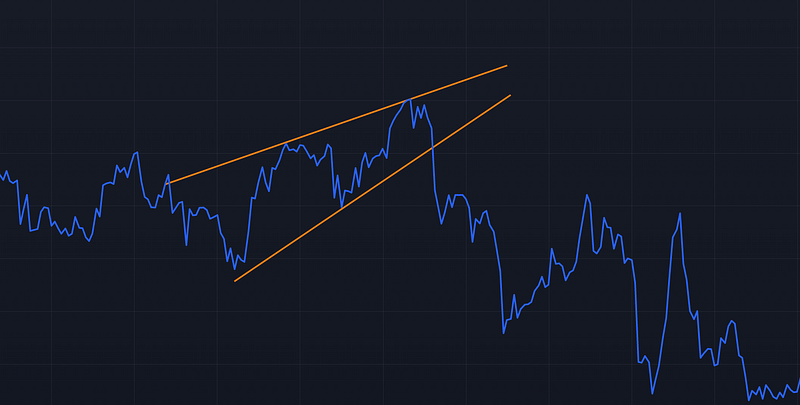
Here it’s a Rising Wedge. There was no pullback, but a strong reversal occurred anyway. When there’s no pullback, it’s a bit harder to find an entry, so it’s better to use other tools. Let’s turn on the Japanese candlesticks.
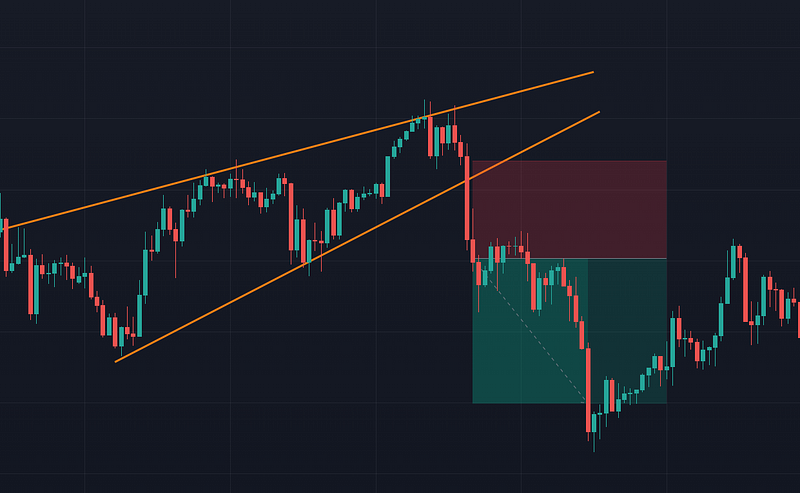
We can see a big red candlestick followed by another relatively big red candlestick. I would have entered after the second red candlestick closed, with a stop loss near the trendline, and a take profit respecting my 1.5 risk-reward ratio criteria.
It would have been a risky trade, that’s why I don’t like to trade these patterns when there is no pullback. The pullback just gives you the best entry most of the time and allows you to have a big risk-reward ratio.
Final Note
Chart patterns are powerful, but you shouldn’t rely only on them. It’s better to confirm them using other things such as support and resistance, indicators, candlestick patterns, etc…
Anyway, they’re a good weapon you can add to your trading arsenal!
To explore more of my trading stories, click here! You can also access all my content by checking this page.
If you liked the story, don’t forget to clap, comment, and maybe follow me if you want to explore more of my content :)
You can also subscribe to me via email to be notified every time I publish a new story, just click here!
If you’re not subscribed to medium yet and wish to support me or get access to all my stories, you can use my link:
A Message from InsiderFinance

Thanks for being a part of our community! Before you go:
- 👏 Clap for the story and follow the author 👉
- 📰 View more content in the InsiderFinance Wire
- 📚 Take our FREE Masterclass
- 📈 Discover Powerful Trading Tools


